| Previous Next Index Image Index Year Selection | |
|
|
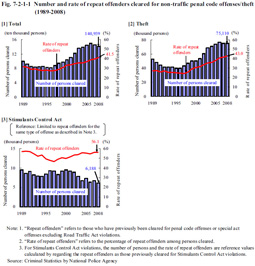
1 Repeat offenders cleared for non-traffic penal code offenses Fig. 7-2-1-1 shows the number of repeat offenders cleared for non-traffic penal code offenses (refers to those who have been cleared for penal code offenses or special act offenses excluding Road Traffic Act violations; hereinafter the same in this subsection unless specified otherwise) and the rate of repeat offenders (refers to the percentage of repeat offenders among those cleared for non-traffic penal code offenses; hereinafter the same in this subsection) over the last 20 years (for repeat delinquencies by juveniles see Section 5 in this chapter).Fig. 7-2-1-1 Number and rate of repeat offenders cleared for non-traffic penal code offenses/theft (1989–2008)
For Stimulants Control Act violations the rate of repeat offenders is remarkably high when compared to those for non-traffic penal code offenses and theft. Due to limitations in the statistical data, however, the figures indicate reference values calculated by regarding the repeat offenders as having been previously cleared for violations of the said Act. The number of repeat offenders of Stimulants Control Act violations has generally followed a decreasing trend since 2001. The rate of repeat offenders, however, decreased from 56.9% in 1989 to 46.7% in 1997, but then turned to an upward trend, being 56.1% in 2008. |