| Previous Next Index Image Index Year Selection | |
|
|
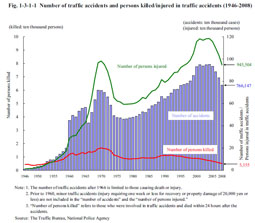
1 Trends in traffic offenses (1) Occurrence of traffic accidentsFig. 1-3-1-1 shows the number of traffic accidents and the number of persons killed or injured in those accidents since 1946. The number of traffic accidents and the number of persons injured in traffic accidents both remained at a high level from 2000, but decreased for four consecutive years from 2005 (See Appendix 1-5). The number of persons killed had been on a decreasing trend from 1993 and fell below 6,000 persons in 2007 for the first time in 54 years since 1953. In 2008, it further decreased to 5,155 (down 10.3% from the previous year). Fig. 1-3-1-1 Number of traffic accidents and persons killed/injured in traffic accidents (1946–2008)
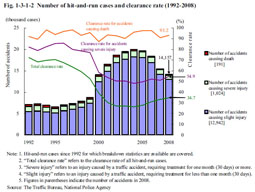
The number of persons cleared for dangerous driving causing death or injury in 2008 was 348 persons (down 18.1% from the previous year) and that for negligence in vehicle driving causing death or injury, etc. was 741,855 (down 9.3% (id.)) (See Table 1-1-1-2). Among these, the number of persons cleared for cases of causing death was 35 (down 35.2% (id.)) for dangerous driving causing death, 4,552 (down 7.4% (id.)) for negligence in vehicle driving causing death and negligence in the pursuit of social activities causing death, and 33 (up 17.9% (id.)) for causing death through negligence (including causing death through gross negligence) (Source: The Traffic Bureau, National Police Agency). (3) Hit-and-run cases Fig. 1-3-1-2 shows the number of hit-and-run cases (refers to cases of breach of duty to provide first-aid pertaining to road traffic accidents causing death or injury; hereinafter the same in this subsection) and the clearance rate since 1992. The number of cases increased sharply from 2000, but then decreased for four consecutive years from 2005 and was 14,157 in 2008, down 1,317 cases (8.5%) from the previous year. The clearance rate had been on a declining trend for overall hit-and-run cases from 1996, but turned to a rising trend from 2005. Limiting the cases to those causing death revealed that the clearance rate remained at the high level of more than 90%. Fig. 1-3-1-2 Number of hit-and-run cases and clearance rate (1992–2008)
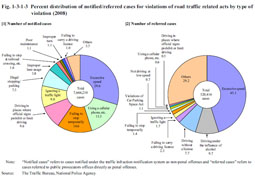
The number of processed cases of violations of road traffic related acts, which is the sum of the number of notified cases that fell under the traffic infraction notification system as non-penal offenses (hereinafter referred to as “notified cases” in this subsection) and the number of cases referred to public prosecutors offices directly as penal offenses (hereinafter referred to as “referred cases” in this subsection), remained in the range of eight millions since 2003 and was 8,186,626 cases (down 3.6% from the previous year) in 2008 (Source: The Traffic Bureau, National Police Agency). Fig. 1-3-1-3 shows the percent distribution of notified/referred cases for violations of road traffic related acts by type of violation in 2008. Fig. 1-3-1-3 Percent distribution of notified/referred cases for violations of road traffic related acts by type of violation (2008)
|