| Previous Next Index Image Index Year Selection | |
|
|
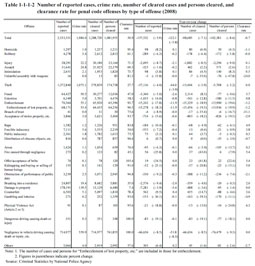
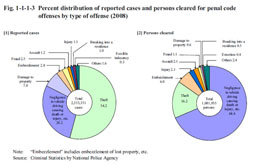
1 Reported cases and crime rate The number of reported cases for penal code offenses reached new post World War II (WWII) highs every year from 1996, peaking at 3,693,928 cases in 2002. However, the number then started to decline and has been decreasing every year since 2003. In 2008, the number of reported cases was 2,533,351 (a decrease of 157,532 cases or 5.9% from the previous year). Examining the number of reported cases from post WWII indicates, however, that the number remains at a considerably high level.The main cause of the recent decline in the number of reported cases for penal code offenses is that the number of reported cases for theft, which typically accounts for about 60% of total penal code offenses every year, has been decreasing since 2003 (See Subsection 1, Section 2). The number of reported cases for non-traffic penal code offenses excluding theft had been on a rise until 2004, but then consistently decreased every year from 2005 to 2008. The crime rate for penal code offenses has basically been on the same trend as the number of reported cases. The crime rate reached new post WWII highs every year from 1998 (at 2,127.2), peaking at 2,897.5 in 2002. It then stared to decline from 2003 and has been decreasing every year, to 1,984.0 (down 122.1 points from the previous year) in 2008 (See Appendix 1-1). Table 1-1-1-2 shows the number of reported cases for penal code offenses and the crime rate by type of offense in 2008 and Fig. 1-1-1-3 [1] shows the percent distribution of reported cases by type of offense. Examining these data by type of offense revealed that the percentage was the highest for theft at 54.2%, followed by negligence in vehicle driving causing death or injury, etc. (28.2%), damage to property (7.0%), embezzlement (including embezzlement of lost property, etc.; hereinafter the same in this section) (2.8%), and fraud (2.5%). Table 1-1-1-2 Number of reported cases, crime rate, number of cleared cases and persons cleared, and clearance rate for penal code offenses by type of offense (2008)
Fig. 1-1-1-3 Percent distribution of reported cases and persons cleared for penal code offenses by type of offense (2008)
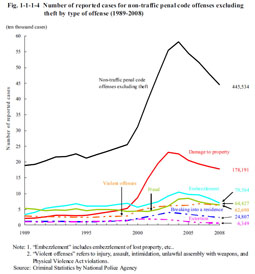
The number of reported cases for non-traffic penal code offenses excluding theft significantly increased from 2000 to 2004. A significant increase in damage to property is considered to have been the main cause of this increase. Fig. 1-1-1-4 Number of reported cases for non-traffic penal code offenses excluding theft by type of offense (1989-2008)
|