| Previous Next Index Image Index Year Selection | |
|
|
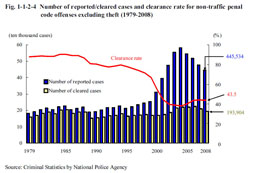
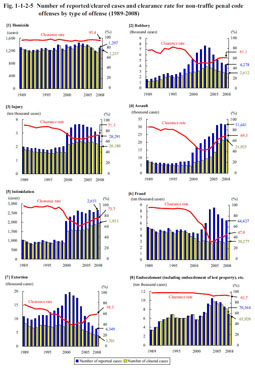
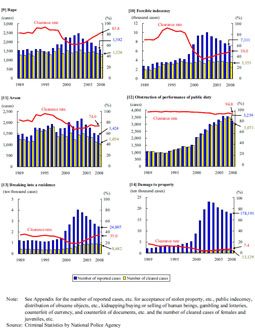
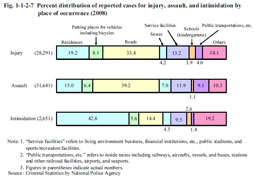
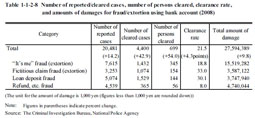
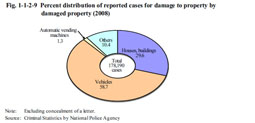
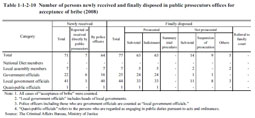
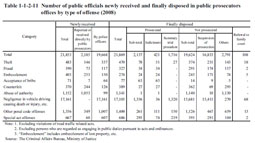
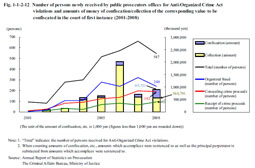
2 Non-traffic penal code offenses excluding theft Fig. 1-1-2-4 shows the number of reported cases, number of cleared cases, and the clearance rate for non-traffic penal code offenses excluding theft over the last 30 years.The number of reported cases for non-traffic penal code offenses excluding theft increased rapidly from 2000, reaching a post WWII high of 581,463 cases in 2004, but then continued to decrease from 2005. In 2008 it was 445,534 cases (down 33,780 cases or 7.0% from the previous year). The number of cleared cases/persons remained stable from 2003, but then decreased for two consecutive years from 2007. In 2008 the number of cleared cases was 193,904 (down 16,645 cases or 7.9% from the previous year) and the number of cleared persons was 165,362 (down 20,194 persons or 10.9% (id.)) (See also Fig. 1-1-1-1). The clearance rate for non-traffic penal code offenses excluding theft used to be at around 90%, but then drastically declined from 2000. It reached a post WWII low of 37.8% in 2004 but then started to rise again from 2005. And although the clearance rate did slightly decline from the previous year at 43.5% in 2008, it is on a recovering trend. Fig. 1-1-2-4 Number of reported/cleared cases and clearance rate for non-traffic penal code offenses excluding theft (1979–2008) Fig. 1-1-2-5 shows the number of reported cases, number of cleared cases, and clearance rate by type of major offense over the last 20 years (See Appendices 1-2 and 1-3).Fig. 1-1-2-5 Number of reported/cleared cases and clearance rate for non-traffic penal code offenses by type of offense (1989–2008) (1) Homicide (See Fig. 1-1-2-5 [1])Although the number of reported cases for homicide has generally remained stable, it did decrease for the four consecutive years from 2004 to 2007, but then slightly increased again in 2008 to 1,297 cases (up 98 cases or 8.2% from the previous year). The clearance rate for homicide has remained steady at a high level (95.4% in 2008). The number of reported cases for random homicide (refers to cases where a random person was killed for no particular reason when they were encountered somewhere frequented by people using weapons, etc.; includes attempted homicide) was three in 2004, six in 2005, four in 2006, eight in 2007, and 14 in 2008. All the suspects were cleared in those cases (Source: The Criminal Investigation Bureau, National Police Agency). (2) Robbery (See Fig. 1-1-2-5 [2]) The number of reported cases for robbery has reached 7,664 in 2003, a record high since 1950, but then decreased for five consecutive years from 2004 to 4,278 cases in 2008 (down 289 cases or 6.3% from the previous year). The clearance rate increased slightly for three consecutive years from 2005 to 2007. The clearance rate in 2008 was the same as the previous year at 61.1%. Table 1-1-2-6 shows the number of reported cases, number of cleared cases, and clearance rate for robbery targeting overnight supermarkets (refers to robbery cases with the aim of the sales proceeds, etc. of convenience stores or supermarkets during their night opening hours of 10:00 p.m. to 7:00 a.m.; includes attempted robbery) over the last 10 years. Table 1-1-2-6 Number of reported/cleared cases and clearance rate for robbery targeting overnight supermarkets (1999–2008) (3) Injury/assault/intimidation (See Fig. 1-1-2-5 [3]-[5])The number of reported cases for injury, assault, and intimidation all sharply increased in 2000. The number of reported cases for injury subsequently continued to increase and has reached the highest since 1975 at 36,568 cases in 2003, but then decreased every year from 2004 to 28,291 cases in 2008 (down 2,695 cases or 8.7% from the previous year). The number of reported cases for assault consistently increased until 2007, but then decreased slightly in 2008 with 31,641 cases (down 325 cases or 1.0% (id.)). The number of reported cases for intimidation had been generally on an increasing trend and was 2,651 cases in 2008 (up 98 cases or 3.8% (id.)). The clearance rate for injury, assault, and intimidation all significantly declined due to a sharp increase in the number of reported cases, but then turned to an increasing trend from around 2004. Fig. 1-1-2-7 shows the percent distribution of reported cases for injury, assault, and intimidation by place of occurrence in 2008. Fig. 1-1-2-7 Percent distribution of reported cases for injury, assault, and intimidation by place of occurrence (2008) (4) Fraud (See Fig. 1-1-2-5 [6])The number of reported cases for fraud increased significantly from 2002, reaching a record high since 1960 with 85,596 cases in 2005. It then turned to a decreasing trend from 2006 and was 64,427 cases in 2008 (down 3,360 cases or 5.0% from the previous year). The clearance rate continued to drastically decline from 1997, reaching a post WWII low of 32.1% in 2004, but then turned to a rising trend from 2005 and was 47.0% in 2008 (up 5.7 points (id.)). One of the major factors in the recent sharp increase in number of reported cases for fraud is the frequent occurrence of fraud cases using bank account. It collectively refers to the following four types of offense: the so-called “it’s me” fraud (fraud (or possibly extortion) case in which the perpetrator phones a victim and pretends to be a family member by saying “it’s me” and asks for money to be immediately transferred to a designated bank account for use in compensating a fictitious problem such as having embezzled some money from a company, etc.), fictitious claim fraud (fraud (or possibly extortion) case in which the perpetrator causes the victims to believe by mail or the Internet that they are in debt and must pay a fictitious charge into a designated bank account), loan deposit fraud (fraud case in which the perpetrator pretends to lend some money to the victims by sending fake documents, etc. to them and making them pay a deposit, etc. into a designated bank account), and refund, etc. fraud (fraud case using computer in which the perpetrator pretends to be a tax office or Social Insurance Office clerk, causes the victims to believe that they will receive a refund from tax or medical expenses, etc., and makes them follow a fictitious procedure to pay some money by transfer between bank accounts through computer). Various measures have been taken including thorough clearance/punishment of criminal groups, right up to the ringleaders, and promotion of publicity and enlightenment activities, etc. in responding to the sharp increase in this type of fraud. Legislative measures to establish new penal provisions have also been taken. First, the Act on Identity Confirmation of Customers, etc. by Financial Institutions and Prevention of Unauthorized Use of Bank Accounts etc. (Act No. 32 of 2002) was amended in 2004 (by Act No. 164 of 2004) to newly establish penal provisions concerning the improper buying and selling of bankbooks, etc. These penal provisions were then succeeded by the Act on Prevention of Transfer of Criminal Proceeds (Act No. 22 of 2007) after abolition of the said act. A total of 444 persons were newly received for violations of these acts in 2008 (Source: Annual Report of Statistics on Prosecution). In addition, cellular phones whose users cannot be identified are often used in this type of fraud cases. The Act on Identification, etc. by Mobile Voice Communications Carriers of their Subscribers, etc. and for Prevention of Improper Use of Mobile Voice Communications Services (Act No. 31 of 2005) therefore obligates mobile voice communications carriers to confirm subscribers’ identification when concluding contracts for services and newly establishes penal provisions against improper buying and selling of cellular phones, etc., in order to eliminate that anonymity. Furthermore, amendment of the said act (by Act No. 76 of 2008) established penal provisions against the improper buying and selling, etc. of SIM cards (IC chips which are installed in cellular phones and enable telephonic calls). A total of 71 persons were newly received for violations of the said act in 2008 (Source: Annual Report of Statistics on Prosecution). Table 1-1-2-8 shows the number of reported/cleared cases, number of persons cleared, clearance rate, and amounts of damages for fraud/extortion using bank account in 2008. Table 1-1-2-8 Number of reported/cleared cases, number of persons cleared, clearance rate, and amounts of damages for fraud/extortion using bank account (2008) As described earlier, and as a result of taking various measures, the number of reported cases for fraud/extortion using bank account has been decreasing over recent years. In 2008, however, it started to increase again with 20,481 cases (up 14.2% from the previous year) and the amount of damages increased to 27.6 billion yen (up 9.8% (id.)). In addition, the clearance rate in 2008, at 21.5%, was higher than the previous year (17.2%) but still at a low level when compared to that for overall fraud/extortion (48.0%) and for non-traffic penal code offenses excluding theft (43.5%) (Source: The Criminal Investigation Bureau, National Police Agency).In July 2008 the National Police Agency and the Ministry of Justice formulated basic policies for measures against fraud using bank account consisting of thorough implementation of clearance, lookout around the area of ATMs, the elimination of anonymous cellular phones and bank accounts, and implementation of activities to prevent damage, which they then published as the “Action Plan to Wipe out Fraud using Bank Account.” To continue implementing thorough regulations and to create an environment in which offenses cannot be easily be committed, efforts also need to be made to develop measures involving the whole of society in both the public and private sectors. (5) Rape/forcible indecency (See Fig. 1-1-2-5 [9][10]) The number of reported cases for rape had been on an increasing trend from 1997 and reached the largest in the last 20 years in 2003 with 2,472 cases. However, it has been decreasing every year since 2004 and was 1,582 cases in 2008 (down 184 cases or 10.4% from the previous year). The clearance rate consistently declined from 1998, reaching a post WWII low of 62.3% in 2002, but then turned to a rising trend from 2003 and was 83.8% in 2008 (up 4.9 points (id.)). The number of reported cases for forcible indecency increased sharply from 1999, reaching a post WWII high (10,029 cases) in 2003, but then consistently decreased every year from 2004 to 7,111 cases in 2008 (down 553 cases or 7.2% from the previous year). It has remained, however, at a high level. The clearance rate drastically declined from 1999, reaching a post WWII low of 35.5% in 2002, but then turned to a rising trend from 2003 and was 50.0% in 2008 (up 3.8 points (id.)). (6) Obstruction of performance of public duty (See Fig. 1-1-2-5 [12]) The number of reported cases for obstruction of performance of public duty has naturally remained at basically the same level as the number of cleared cases. It had been on a significant upward trend from 1994, reaching a post WWII high of 3,576 cases in 2006, but then decreased slightly in 2008, as it did the previous year, to 3,239 cases (down 330 cases or 9.2% from the previous year). (7) Damage to property (See Fig. 1-1-2-5 [14]) The number of reported cases for damage to property significantly increased from 2000, reaching 230,743 cases in 2003. It then consistently decreased every year from 2004 and was 178,191 cases (down 7,281 cases or 3.9% from the previous year) in 2008. It has remained, however, at a high level. The clearance rate was generally on a declining trend from 1989 to 2003, then began to increase slightly but consistently from 2004, reaching 7.4% in 2008. It remained low compared to total non-traffic penal code offenses. Fig. 1-1-2-9 shows the percent distribution of reported cases for damage to property by damaged property in 2008. Fig. 1-1-2-9 Percent distribution of reported cases for damage to property by damaged property (2008) (8) Acceptance of bribe, etc.Table 1-1-2-10 shows the number of persons newly received and finally disposed in public prosecutors offices for acceptance of bribe in 2008. Table 1-1-2-10 Number of persons newly received and finally disposed in public prosecutors offices for acceptance of bribe (2008) Table 1-1-2-11 shows the number of public officials newly received and finally disposed in public prosecutors offices by type of offense in 2008.Public officials newly received for negligence in vehicle driving causing death or injury, etc. accounted for the majority with 17,161 persons (78.5%). Table 1-1-2-11 Number of public officials newly received and finally disposed in public prosecutors offices by type of offense (2008) (9) Organized crimeFig. 1-1-2-12 shows the number of persons newly received by public prosecutors offices for Anti-Organized Crime Act violations and amounts of money of confiscation/collection of the corresponding value to be confiscated in the court of first instance over the last eight years. Although the number of persons newly received had been on an increasing trend since the enforcement of the Anti-organized Crime Act in 2000, it decreased by 17.6% from the previous year in 2008 to 547 persons. In recent years crime proceeds, etc. of between 0.5 and 2 billion yen a year have been subject to confiscation. Fig. 1-1-2-12 Number of persons newly received by public prosecutors offices for Anti-Organized Crime Act violations and amounts of money of confiscation/collection of the corresponding value to be confiscated in the court of first instance (2001–2008) |
