| Previous Next Index Image Index Year Selection | |
|
|
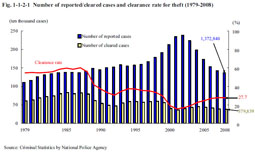
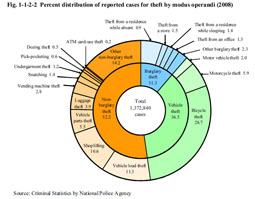
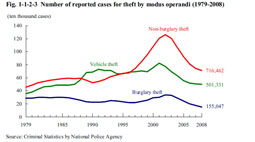
1 Theft Theft accounted for 75.5% (in 2008) of reported non-traffic penal code offenses. Fig. 1-1-2-1 shows the number of reported cases, number of cleared cases, and clearance rate for theft over the last 30 years.Fig. 1-1-2-1 Number of reported/cleared cases and clearance rate for theft (1979–2008) The number of reported cases for theft increased and the clearance rate decreased from 1995 to 2001. However, the clearance rate then started to rise again in 2002 and the number of reported cases started to decrease in 2003, thus putting the brake on a worsening situation.The number of reported cases turned to a decreasing trend after reaching a post WWII high of 2,377,488 cases in 2002 and then subsequently continued to decrease. In 2008 it was 1,372,840 cases, down 1,004,648 cases (42.3%) from 2002. The number of cleared cases was 379,839 (down 15,404 cases or 3.9% from the previous year) and the number of cleared persons was 174,738 (down 5,708 persons or 3.2% (id.)) in 2008. The clearance rate, however, then continued to rise from 2002 and was 27.7% in 2008, up 12.0 points from the post WWII low in 2001. Fig. 1-1-2-2 shows the percent distribution of reported cases for theft by modus operandi in 2008. Fig. 1-1-2-2 Percent distribution of reported cases for theft by modus operandi (2008) Fig. 1-1-2-3 shows the number of reported cases for theft by modus operandi over the last 30 years.Fig. 1-1-2-3 Number of reported cases for theft by modus operandi (1979–2008) |


