| Previous Next Index Image Index Year Selection | |
|
|
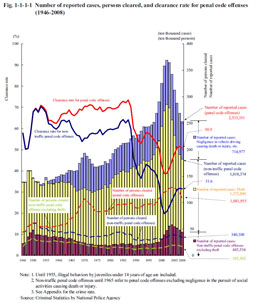
Principal data on penal code offenses, 2008 (Year-on-year change) [Change from 1989] [1] Number of reported cases Penal code offenses 2,533,351 (–157,532, –5.9%) [+12.0%] Non-traffic penal code offenses 1,818,374 (–90,896, –4.8%) [+8.7%] Non-traffic penal code offenses excluding theft 445,534 (–33,780, –7.0%) [+134.9%] [2] Number of cleared cases Penal code offenses 1,288,720 (–98,685, –7.1%) [–5.3%] Non-traffic penal code offenses 573,743 (–32,049, –5.3%) [–25.7%] Non-traffic penal code offenses excluding theft 193,904 (–16,645, –7.9%) [+26.6%] [3] Number of persons cleared Penal code offenses 1,081,955 (–102,381, –8.6%) [+15.8%] Non-traffic penal code offenses 340,100 (–25,902, –7.1%) [+8.7%] Non-traffic penal code offenses excluding theft 165,362 (–20,194, –10.9%) [+40.6%] [4] Crime rate Penal code offenses 1,984.0 (–122.1 points) [+148.7 points] Non-traffic penal code offenses 1,424.0 (–70.3 points) [+65.9 points] Non-traffic penal code offenses excluding theft 348.9 (–26.2 points) [+195.0 points] [5] Clearance rate Penal code offenses 50.9% (–0.7 points) [–9.3 points] Non-traffic penal code offenses 31.6% (–0.2 points) [–14.6 points] Non-traffic penal code offenses excluding theft 43.5% (–0.4 points) [–37.2 points] (Source: Criminal Statistics by National Police Agency, the Statistics Bureau, Ministry of Internal Affairs and Communications (population data)) Fig. 1-1-1-1 shows the number of reported cases, number of persons cleared, and clearance rate for penal code offenses since 1946 (See Appendix 1-1). Fig. 1-1-1-1 Number of reported cases, persons cleared, and clearance rate for penal code offenses (1946–2008)
|