| Previous Next Index Image Index Year Selection | |
|
|
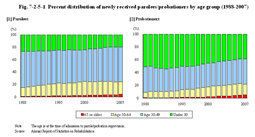
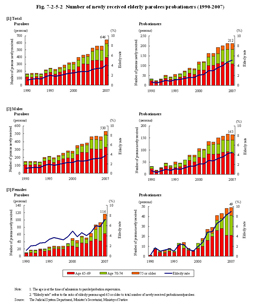
1 Changes in the number of elderly offenders Fig. 7-2-5-1 Percent distribution of newly received parolees/probationers by age group (1988–2007) By sex (data by sex is only available for after 1990), although the number itself is small, the rate of increase in the number of parolees and probationers is both significantly higher for females than males (see Fig. 7-2-5-2). By age group, the percent ratio of those aged 70 or older has been increasing since around 2004. The rate of increase is remarkable with females in particular.Fig. 7-2-5-2 Number of newly received elderly parolees/probationers (1990–2007) |

