2 Current status with elderly offenders
In light of the trend in which the number of elderly offenders has been increasing far more rapidly than the total population of elderly, it is likely that the number of elderly offenders will continue to further increase in accordance with the rapid growth of the elderly population in Japan. The status of the increase in elderly offenders is summarized here, and described in detail in Chapter 2.
Fig. 7-1-12 shows the number and percent ratio of elderly (hereinafter the rate of elderly to total subjects is referred to as “elderly rate”) in each procedural stage.
Fig. 7-1-12 Number of elderly and elderly rate in each procedural/treatment stage (1988–2007)
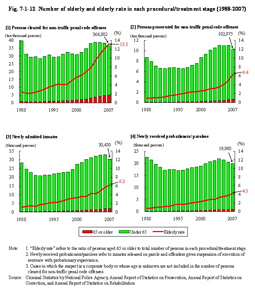
Both the number and elderly rate has increased.
In addition,
Fig. 7-1-13 compares the elderly population with a crime index of elderly in each procedural stage.
Let the figures in 1988 be benchmarked at 100. In contrast to the elderly population, which doubled over 20 years to 199.2 in 2007, the number of elderly in each procedural stage had been increasing at the higher rate of 491.6 for those cleared for non-traffic penal code offenses, 742.3 for those prosecuted for non-traffic penal code offenses, 607.7 for newly admitted inmates, and 501.8 for newly received probationers and parolees.
Fig. 7-1-13 Crime index of elderly in each procedural/treatment stage (1988–2007)
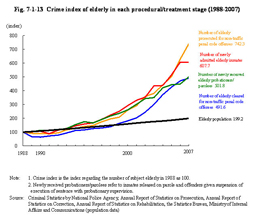
Fig. 7-1-14 shows the rate per population of persons cleared for non-traffic penal code offenses by age group.
Fig. 7-1-14 Rate per population of persons cleared for non-traffic penal code offenses by age group (1998–2007)
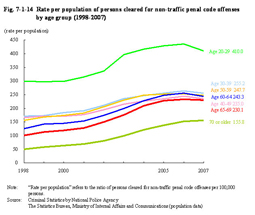
The rate per population of persons of “Age 65 through 69” in 2007, for instance, has been increasing at the same rate as those of “Age 30 through 39” in 2003, which is described in more detail in Chapter 2.
Fig. 7-1-15 shows the rate per population of newly admitted inmates by age group. And, while not at as high a rate as the number of cleared persons, the rate per population of newly admitted inmates aged 65 or older increased at a higher rate than other age groups.
Fig. 7-1-15 Rate per population of newly admitted inmates by age group (1998–2007)
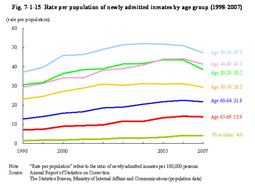
The data indicates that the increase in elderly offenders cannot simply be explained by the growth of the elderly population, and suggests that other factors such as their increased range of possible activities and isolation also exist in accelerating the increase.
Lastly, changes in the distribution of the population and the number of offenders by age (group) are compared for 1997 and 2007.
Fig. 7-1-16 shows the number of persons cleared for non-traffic penal code offenses by age group and the distribution of the population in 1997 and 2007.
Fig. 7-1-16 Number of persons cleared for non-traffic penal code offenses by age group and distribution of the population (1997, 2007)
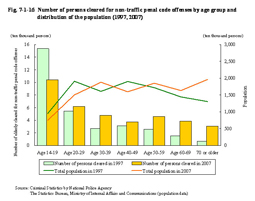
The distribution of the population in 1997 and 2007 shows slight ups and downs in the respective age groups. Although the effect of those changes cannot be ignored, the number of persons cleared for non-traffic penal code offenses in 1997 exceeded that in 2007 for the age group of 14 through 19 while the situation was reversed for those aged 20 or older. It was about 2.5 times as many as in 2007 than in 1997 for the age group of 60s and about 4.6 times as many in 2007 than in 1997 for the age group of 70 or older.
Similarly,
Fig. 7-1-17 shows the number of newly admitted inmates and the distribution of the population by age (from 20 through 89) in 1997 and 2007.
Fig. 7-1-17 Number of newly admitted inmates and distribution of the population by age (1997, 2007)
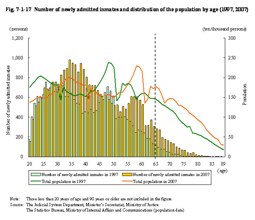
The number of newly admitted elderly inmates in 2007 far exceeded that in 1997. The number of newly admitted inmates of a higher age increased in 2007. In addition, the number of newly admitted inmates belonging to the so-called “baby-boom generation” (those born in 1947 through 1949) was remarkably high at about the same level in both 1997 (baby-boomers were around 48 through 50 years old) and 2007 (58 through 60 (id.)). If the increase in the number of elderly offenders is not suppressed in the future, the number of newly admitted elderly inmates will increase in far greater numbers than today as the “baby-boom generation” becomes elderly.