| Previous Next Index Image Index Year Selection | |
|
|
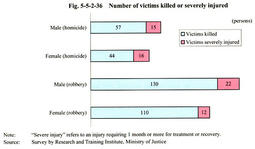
5 Analysis of victims (1) Number and age group of victims Fig. 5-5-2-36 shows the number of victims killed or severely injured (suffering an injury that requires 1 month or more for treatment or recovery) in heinous offense cases. Although the number of male victims is larger, the rate of females to all victims killed or severely injured (female rate) is 43.6% for homicide and 44.5% for robbery. Considering that, as mentioned in Chapter 3 , the female victim rate for homicide and robbery cases in general is around 35%, the female rate for victims of serious offenses is slightly higher.
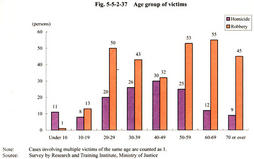
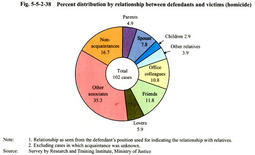
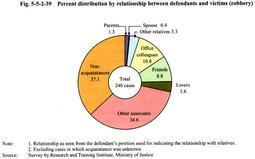
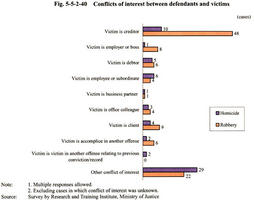
Fig. 5-5-2-37 shows the number of victims by age group. Homicide victims are mainly seen in the 40-49 age group but distributed in all age groups. In contrast, among robbery victims, the number of those in their 40s is small whereas more victims are seen in the 20-29, 30-39, and 50 or over age groups. In particular, the number of elderly victims aged 60 or over is larger for robbery than for homicide. This trend, which is almost same as the distribution by age group of victims of robbery resulting in death, is due to the fact that almost all robbery cases for which the death penalty or life imprisonment were demanded are cases of robbery resulting in death. Among the cases targeted in this survey, 34 cases targeted elderly people who lived alone, suggesting that robbery offenders frequently target elderly people, and in particular those who live alone. Fig. 5-5-2-36 Number of victims killed or severely injured Fig. 5-5-2-37 Age group of victims (2) Relationship between victims and defendants-heinous acts against acquaintances-- Fig. 5-5-2-38 , Fig. 5-5-2-39 , Fig. 5-5-2-40 show the relationship between victims and defendants. As for acquaintance or relative relationship, among homicide victims, 19.6% were defendants' relatives, 63.7% acquaintances, and 16.7% non-acquaintances. As mentioned in Chapter 2 , in homicide cases in general, 41.6% of victims were suspected perpetrators' relatives, 42.7% acquaintances, and 15.7% non-acquaintances. Thus, the rate of relatives is lower among serious offenses. This may be due to the fact that in cases of homicide between relatives, the perpetrators often have special motives, background factors, or reasons as well as extenuating circumstances, and therefore death penalty or life imprisonment is rarely demanded in these cases unlike the cases targeted in this survey. Among robbery victims, 5.0% were defendants' relatives, 57.9% acquaintances, and 37.1 % non-acquaintances. The rate of non-acquaintances was higher among robbery victims than among homicide victims. However, as mentioned in Chapter 2 , in robbery cases in general, 0.3% of victims were suspected perpetrators' relatives, 9.7% acquaintances, and 90% non-acquaintances. Thus, the rates of acquaintances and relatives are remarkably higher among the cases targeted in this survey. This may be due to the fact that, in such cases as those targeted in this survey, the perpetrators often have acquaintances or conflicts of interest with the victims and therefore go as far as to kill them in order to achieve robbery and prevent the offense from being detected.
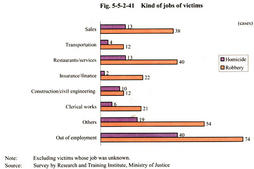
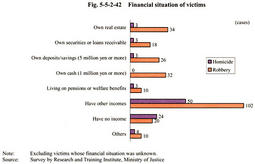
As for conflicts of interest between victims and defendants, victims often have some credits (claims) to defendants. There are a considerable number of cases in which the perpetrators attack their creditors in some manner even through their conduct does not fall under robbery provided in Article 236(2) that is committed for the purpose of becoming exempt from debts. Fig. 5-5-2-38 Percent distribution by relationship between defendants and victims (homicide) Fig. 5-5-2-39 Percent distribution by relationship between defendants and victims (robbery) Fig. 5-5-2-40 Conflicts of interest between defendants and victims (3) Employment situation of victims Fig. 5-5-2-41 and Fig. 5-5-2-42 show kinds of jobs and financial situation of victims. Sales-related jobs and restaurant/service-related jobs are common whereas the number of unemployed victims is the largest. Among the victims targeted in this survey, 43 persons are elderly people (aged 60 or more) not in employment, which indicates that elderly people not in employment are frequently targeted for heinous offenses. As for financial situation, most victims own real estate as well as financial assets, such as savings, cash, loans receivable or have incomes, and the number of victims who have no revenue is extremely small. The fact that the number of unemployed victims is the largest may be because many of such unemployed victims own financial assets or pension revenues (See Chapter 3, Section 6-5 ).
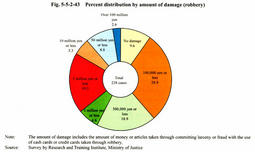
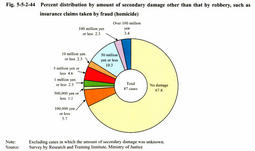
Fig. 5-5-2-41 Kind of jobs of victims Fig. 5-5-2-42 Financial situation of victims (4) Amount of damage-offenses intended to take a large amount of gains Fig. 5-5-2-43 and Fig. 5-5-2-44 show the amount of damage by robbery (including the amount of damage by larceny or fraud with the use of cash cards or credit cards that were taken through robbery) and the amount of secondary damage by homicide (amount of pecuniary damage other than that by robbery, such as insurance claims taken by fraud). Among the robbery cases, the amount of damage was 500,000 yen or less in 57.5% whereas a large amount of property over 10 million yen was taken in 11.4%, implying the existence of offenders who commit robbery as an occupation targeting victims that have a large amount of property. Among the homicide cases, no damage was incurred in 67.8% because homicide is often committed for purposes other than obtaining gains. However, homicide is sometimes committed for the purpose of obtaining a large amount of life insurance claims by fraud. For this reason, the amount of damage exceeded 10 million yen in 16.1 % and 100 million yen in 3.4%. These results suggest that in many serious cases, robbery or homicide is committed with the aim of making a fortune in one stroke.
Fig. 5-5-2-43 Percent distribution by amount of damage (robbery) Fig. 5-5-2-44 Percent distribution by amount of secondary damage other than that by robbery, such as insurance claims taken by fraud (homicide) |