| Previous Next Index Image Index Year Selection | |
|
|
2 Trends by age group and gender Fig. 4-1-1-3 shows the trends in the rate per population for the number of juveniles cleared for general penal code offenses by age group since 1966 (see Appendix 4-2 ).
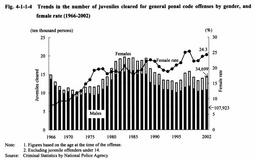
Fig. 4-1-1-3 Trends in the rate per population of juveniles cleared for general penal code offenses, by age group (1966-2002) Fig. 4-1-1-4 shows the trends in the number of juveniles cleared for general penal code offenses by gender and the female rate. The female rate has generally showed an upward trend since 1994. It decreased once in 1999 but rose again in 2000, and it was 24.3% in 2002. Fig. 4-1-1-4 Trends in the number of juveniles cleared for general penal code offenses by gender, and female rate (1966-2002) |