| Previous Next Index Image Index Year Selection | |
|
|
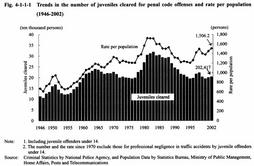
1 Trends in the number of juveniles cleared Fig. 4-1-1-1 shows the trends in the number of juveniles cleared for penal code offenses and their rates per population (the number of cleared juvenile offenders per 100,000 juveniles aged 10 and over but less than 20) since 1946 (see Appendix 4-1 ). The trends in the number of juveniles cleared for penal code offenses indicate 3 cycles, the first peaking in 1951 at 166,433, the second in 1964 at 238, 830, and the third in 1983 at 317, 438.
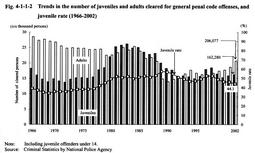
The number of juveniles cleared and relevant rate per population, which had shown upward trends since 1996, went down in 1999 and 2000, but increased again in 2001. In 2002, the number of cleared juveniles reached 202,417 (up 1.7% from the previous year), equivalent to 1,506.2 persons per 100,000 juveniles (up 4.0% from the previous year). Fig. 4-1-1-1 Trends in the number of juveniles cleared for penal code offenses and rate per population (1946-2002) Although the number of juveniles cleared for general penal code offenses increased from 1975, and formed a big wave until 1989, and continue to increase and decrease, it was 162,280 (up 2.2% from the previous year) in 2002. The juvenile rate has been decreasing along with increase in the number of adults cleared since 1998, and was 44.1 % in 2002. Fig. 4-1-1-2 Trends in the number of juveniles and adults cleared for general penal code offenses, and juvenile rate (1966-2002) |