| Previous Next Index Image Index Year Selection | |
|
|
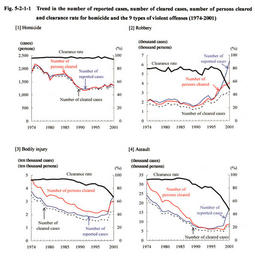
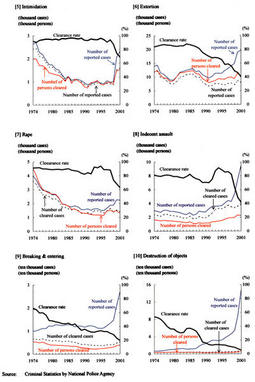
1 Overall trends in the number of reported cases, etc. Fig. 5-2-1-1 shows the trends in the number of reported cases, the number of cleared cases, the number of persons cleared and the clearance rate for homicide and the 9 types of violent offenses, by type of offense.
Fig. 5-2-1-1 Trend in the number of reported cases, number of cleared cases, number of persons cleared and clearance rate for homicide and the 9 types of violent offenses (1974-2001) > (1) Rapid increase in the number of reported cases In 2001, the number of reported cases for the 9 types of violent offenses in total increased by 75,182 over the previous year. The number for destruction of objects showed a significant increase and accounted for the majority of the overall increase, followed by bodily injury, breaking and entering, extortion, and assault, all of which showed a sharp rise.
The 9 types of violent offenses can be categorized into the following 3 groups from the perspective of the time of increase/decrease in the number of reported cases. Group 1: Types of offenses of which the numbers of reported cases showed a repeated trend of gradual increase and decrease for a long period of time and then started to rise sharply during the period from 1996 to 1998 (robbery, extortion, breaking and entering). Group 2: Types of offenses of which the numbers of reported cases started to rise in around 1996 after showing a downward trend for a long time, and subsequently has been increasing rapidly since 2000 (bodily injury, assault, intimidation, rape). Group 3: Types of offenses of which the numbers of reported cases has been on the rise since 1987 (indecent assault, destruction of objects). With respect to robbery, extortion and breaking and entering in Group 1, the numbers of reported cases showed a declining trend below 2,000 since 1985, but started to increase in around 1990 and have been on a sharp rise since 1998. More specifically, the number of reported cases of extortion took a sharp upward turn in around 1996, after repeatedly fluctuating at around 10,000. The number for breaking and entering also started to increase in 1996 and has been on a sharp rise since 1998 after staying at around 10,000. These 2 types of offenses share a characteristic of having had turning points toward sharp rises during the period from 1996 to 1998. Both robbery and extortion are offenses of taking property with the use of violence. Breaking and entering is not always committed for the purpose of taking property, but it is committed as a means for committing invasive robbery. Furthermore, robbery committed by breaking and entering houses with the use of special lock-picking tools, which had not been so frequently used before, started to frequently occur during this period. In light of these facts, the characteristic trends of robbery, extortion and breaking and entering in Group 1 seem to indicate that offenses for the purpose of taking property started to rapidly increase during the period from 1996 to 1998. As for bodily injury, assault, intimidation and rape in Group 2, the numbers of reported cases of the 3 offenses except for rape were on the decline more or less constantly until around 1991, but after showing a slight decrease and flat trend for several years, they started to increase in around 1996 and have been rising sharply since 1998. The number of reported cases of rape showed a clear upward turn in 1997 and leveled off in 2001, showing almost the same trend as other types of offense in this group for the period other than these 2 years. The types of offense in Group 2 are offense of a violent nature that are committed by causing direct damage to the body of the victim for the purpose of place the victim under control with violence. The number of reported cases of the offenses in this group marked an upward turning point in 1996 and increased rapidly in 2000 as the offenses in Group 1. As for the types of offenses in Group 3, indecent assault and destruction of objects, the numbers of reported cases started to increase in 1987 after showing a repeated trend of gradual increase or decrease. (2) Increase in the number of cleared cases and in the number of person cleared and decrease in the clearance rate The number of cleared cases and the number of persons cleared for the 9 types of violent offenses were on the decline since 1974 but leveled off in 1992 and then started to increase in 1997. In particular, the numbers of persons cleared for bodily injury, assault, intimidation and extortion, which had been on a flat trend from 1991 to 1999, started to increase in 2000.
However, despite the increase in the number of cleared cases and in the number of persons cleared, the clearance rates for the 9 types of violent offenses showed a gradual decline more or less constantly since 1984, and they are dropping sharply due to the sharp rise in the numbers of reported cases in the past few years. When this declining trend is examined by type of offense, the clearance rate for robbery had stayed within the 70-80% range until 1997, but started to rapidly decrease in 1998 and dropped below the 50% mark in 2001. The clearance rates for bodily injury, assault and extortion remained at a high level within the range of 80% or over but below 90% until the latter half of the 1970s, but started to steadily decrease since 1985. The rate of decrease was accelerated in 1997 and 1998, falling from the 70-80% range to the 40-60% range. The sharp drop in the clearance rates seem to be due to the complicated mixture of various social and economic factors. According to the quantitative trend, the numbers of cleared cases and the numbers of persons cleared increased significantly over the previous year both in 2000 and 2001, which indicates the results of efforts made by the police and other investigating authorities. However, as the numbers of reported cases increased rapidly to a far larger extent, the police and other investigating authorities seem to be unable to deal with all reported cases. For example, the number of reported cases showed the same trend of increase and decrease as the movement of the number of cleared cases until 1997 as for robbery and until 1996 as for bodily injury and assault. However, subsequently, though an increasing trend is seen both in the number of cleared cases and the number of persons cleared for robbery as well as in the numbers of persons cleared for bodily injury and assault, the numbers of reported cases far more increased significantly. Thus, the reported cases and the number of cleared cases have been off balance. (3) Trends of homicide and homicide on the occasion of robbery The number of reported cases, the number of cleared cases and the number of persons cleared for homicide had stayed at around 2,000 cases (persons) since around 1975. These numbers dropped sharply after decreasing to about 1,700 cases (persons) during the period from 1980 to 1985, and have been between 1,200 and 1,300 cases (persons) since 1990. During this period, the clearance rate remained within the 94-98% range, at an unparalleled high level in the world. However, the rate has been on a slight decline in these years.
The clearance rate for homicide on the occasion of robbery/robbery resulting in death or bodily injury, which is the most violent type of robbery, remained at as high a level as homicide, above 75%, alternating from 81.3 to 82.1, 104.8, 87.1, 105.1, 87.8, 93.6, 75.3, 78.9, and 77.1 during the period from 1992 to 2001, in that order (the rate sometimes exceeded 100% because the cases cleared in a given year include those reported in previous years). However, we should pay attention to the future trend because the clearance rate in the past 2 or 3 years was between 75% and 80%. |

