| Previous Next Index Image Index Year Selection | |
|
|
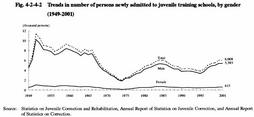
2 Admission and discharge (1) Admission Trends in the number of persons newly admitted to juvenile training schools since 1949 are shown in Fig. 4-2-4-2 . 6,008 juveniles were newly admitted in 2001, down 0.7% from the previous year. The average number of juveniles detained per day stood at 4,807, up 6.2% (see Appendix 4-11 ). Assuming 1995 as 100 for index purposes, 169 is applied to 2001 (male 172, female 149). Even examining the classification of long-treatment and short-treatment, both of them were seen to hit bottom in 1995, and to make continued increases thereafter.
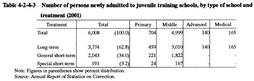
Fig. 4-2-4-2 Trends in number of persons newly admitted to juvenile training schools, by gender (1949-2001) In 2001, no convicted juvenile was imprisoned to juvenile training schools. Table 4-2-4-3 Number of persons newly admitted to juvenile training schools, by type of school and treatment (2001) (2) Discharge 5,981 Persons were discharged from juvenile training schools in 2001, of which 96.8% (5,788 persons) were released on parole. 31.7% of those discharged found jobs, 48.3%were seeking employment, 10.7% wished to enter schools at higher levels, 2.2% returned to junior high schools and 2.2% returned to senior high school. Only 3.8% were discharged with no prospects for subsequent education or employment. The percentage of those who were discharged from juvenile training schools and found jobs has been on a downward trend, dropping from figures within the range of 40%or over but below 50%in the years 1996, 1997, and 1998, to figures within the range of 30% or over but below 40% in the 3 most recent years (1999, 2000, and 2001). The average detention period of those released on parole was 381 days for long-term treatment, 150 days for general short-term treatment, and 81 days for special short-term treatment (Source: Annual Report of Statistics on Correction).
|