| Previous Next Index Image Index Year Selection | |
|
|
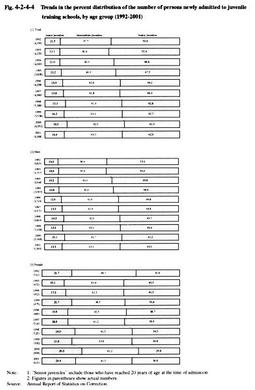
3 Characteristics of newly admitted juveniles (1) Age at time of admission Fig. 4-2-4-4 shows the trends in the percent distribution of juveniles newly admitted for 10 years since 1992, by age group. Examining the total number, the percentage of junior juveniles and intermediate juveniles showed a gradual uptrend, and the percentage of senior juveniles showed a downtrend. By gender, the percentage of male senior juveniles showed a consistent downward trend, down by about 10 points in 2001, compared with 1992. The percentage of females did not show any major change for the trends in the percent distribution of juveniles by age, and the percentage of intermediate juveniles was highest for every year. Comparing males and females, the percentage of females for junior juveniles was almost twice as much as the percentage of males.
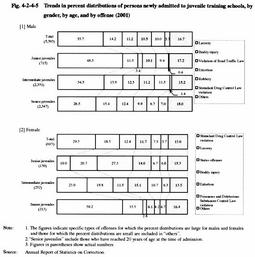
Fig. 4-2-4-4 Trends in the percent distribution of the number of persons newly admitted to juvenile training schools, by age group (1992-2001) As for persons newly admitted in 2001, as regards age at the time of admission by gender, 17-year-olds had the largest share in the number of males newly admitted (25.3%), followed by 18-year-olds (23.5%), 19-year-olds (20.0%), 16-year-olds (18.0%). This is the same order as the previous year. In contrast, 17-year-olds were most prevalent among females (21.3%), followed by 16-year-olds (19.7%), 19-year-olds (17.9%) and 18-year-olds (16.4%).(2) Type of offense The percent distributions by offense of juveniles newly admitted by gender and by age are shown in Fig. 4-2-4-5. The percent distribution of larceny was largest for males, followed by bodily injury, violation of the Road Traffic Law, extortion, robbery, and Stimulant Drug Control Law violations. Compared with the previous year, violation of the Road Traffic Law and extortion were reversed.
The percent distribution of Stimulant Drug Control Law violations was largest for females, followed by larceny, status offense, bodily injury, extortion, and Poisonous and Deleterious Substances Control Law violation. Compared with the previous year, larceny and status offense were reversed. Larceny showed an increase of 5.8 points, and status offenses showed a decrease of 4.5 points (see Appendix 4-12 ). Also, the highest percent distribution of larceny for males becomes lower as the juveniles get older. In contrast, however, bodily injury and extortion following larceny become higher, as the juveniles get older. The percent distribution of Stimulant Drug Control Law violations for females becomes higher as the juveniles get older. On the other hand, the percent distribution of larceny and status offense became lower as they got older. (3) Guardians and situation of cohabitation Among the juveniles newly admitted in 2001, 50.2% (51.3% for males and% for females) had guardians who were their biological parents. Both the percentages for males and females declined from the previous year (51.7% for males and 43.0%for females in 2000).
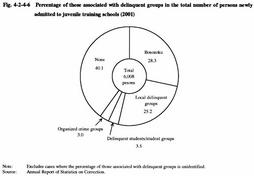
79.4%of male juveniles newly admitted lived with their families at the time of delinquency. And 66.3% of female juveniles newly admitted lived with their families at the time of delinquency (Source: Annual Report of Statistics on Correction). Fig. 4-2-4-5 Trends in percent distributions of persons newly admitted to juvenile training schools, by gender, by age, and by offense (2001) (4) Delinquent groups and accomplices Fig. 4-2-4-6 shows the percentage of those associated with delinquent groups in the total number of persons newly admitted to juvenile training schools. 59.9% of the total number of persons newly admitted to juvenile training schools was those associated with delinquent groups (62.0% of males and 41.7% of females). Examining the details thereof by gender, the percentage of bosozoku had the largest share for male juveniles (49.0%), followed by local delinquent groups (40.7%), delinquent students and student groups (5.6%). The percentage of local delinquent groups had the largest share for female juveniles (59.8%), followed by bosozoku (23.8%) and organized crime groups (8.6%).
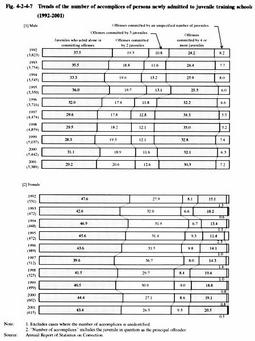
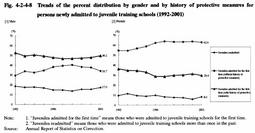
For the last 10 years, the percent distribution of bosozoku and local delinquent groups has not seen any major change. However, the number of members has increased consistently for both since 1996. The number of members for bosozoku increased from 889 persons in 1995 to 1,695 in 2001 (about 1.9 times), and the number of members for local delinquent groups increased from 934 persons in 1995 to 1,511 persons in 2001 (about 1.6 times). Fig. 4-2-4-6 Percentage of those associated with delinquent groups in the total number of persons newly admitted to juvenile training schools (2001) Fig. 4-2-4-7 shows the trends of the number of accomplices of persons newly admitted to juvenile training schools for the 10 years since 1992.Examining the percent distribution of juveniles who acted alone in committing offenses, the percent distribution for male juveniles was consistently about 10% lower than that for females. Also, the percentage of juveniles who acted alone in committing offenses has been gradually declining for males and females. During the period from 1992 to 2001, the percentage decreased from 37.5% to 29.2% for males and from 47.6% to 43.4% for females. In contrast, the percentage for offenses committed by 4 or more juveniles went from 24.2% to 30.3% for males, and from 15.1% to 20.5% for females. No major change was indicated regarding the percentage for offenses committed by 2 juveniles or the percentage for offenses committed by 3 juveniles. 69.3% of juveniles newly admitted in 2001 had accomplices (70.8% for males, and 56.6% for females). As for the relationship thereof, friends were the most frequent accomplices, accounting for 55.0% of the juveniles who had accomplices (54.4% for males and 62.1% for females). Examining the relationship between the number of accomplices and types of offense, larceny, Stimulant Drug Control Law violation, and status offense had the largest shares regarding juveniles who acted alone in committing offenses, in that order. Larceny, extortion, and Stimulant Drug Control Law violation had the largest shares for offenses committed by 2 juveniles, in that order. Larceny, extortion, and robbery had the largest shares for offenses committed by 3 juveniles, in that order. Larceny, bodily injury, and robbery had the largest shares regarding offenses committed by 4 or more juveniles, in such order. Violation of Road Traffic Law, bodily injury, and larceny had the largest shares for offenses committed by an unspecified number of juveniles, in that order (Source: Annual Report of Statistic on Correction). Fig. 4-2-4-7 Trends of the number of accomplices of persons newly admitted to juvenile training schools (1992-2001) (5) History of protective measures Fig. 4-2-4-8 shows trends in the percent distribution for history of protective measures for persons newly admitted to juvenile training schools for the 10 years since 1992. As for male juveniles, about 85% of the total number of persons who newly admitted to juvenile training schools was those who were admitted to juvenile training schools for the first time, and as for female juveniles, about the figure for first time admittance was 92%. No major change occurred thereto. Examining juveniles with or without a history of protective measures out of all cases as for male juveniles, the number of those who have a history of protective measures is always larger than those who do not. As for female juveniles, the number of those who do not have a history of protective measures is always larger than those who do.
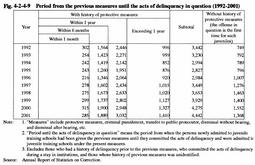
The percentage of those who admitted to juvenile training schools for the first time without a history of protective measures is gradually increasing for female juveniles. Fig. 4-2-4-8 Trends of the percent distribution by gender and by history of protective measures for persons newly admitted to juvenile training schools (1992-2001) (6) Previous measures Fig. 4-2-4-9 shows the trend in the number of persons newly admitted to juvenile training schools for the 10 years since 1992, by the period from the previous measures until the act of delinquency in question. The percentage of those who had previous measures was within the range of 70% or over but below 85%. Among them, those who committed the act of delinquency in question within 1 month after the previous measures was within the range of 6% or over but below 9%, those who committed the act of delinquency in question within 6 months thereafter was within the range of 42% or over but below 48%, and those who committed the act of delinquency in question within 1 year was within the range of 68% or over but below 73%. That is to say, those who committed acts of delinquency again within 1 year of being given the previous measures accounted for almost 70% of the total number of those who committed acts of delinquency again.
In addition, the percentage of juveniles who do not have a history of protective measures (the offense in question is the first time for such juveniles had risen gradually until 1998. However, since then it has declined slightly and it was 23.5% or about 1/4 of the total number of persons newly admitted to juvenile training schools in 2001. Fig. 4-2-4-9 Period from the previous measures until the acts of delinquency in question (1992-2001) (7) Abase of drags As shown in Fig. 4-2-4-5 , 29.3% of juveniles newly admitted in 2001 was those admitted for Stimulant Drug Control Law violation, and 5.7% thereof was for Poisonous and Deleterious Substances Control Law violation for female juveniles. In contrast 3.7% thereof was for Stimulant Drug Control Law violation for male juveniles.
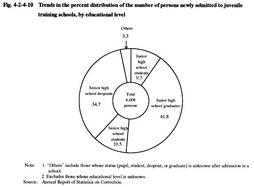
Out of the persons newly admitted to juvenile training schools in 2001, by type of drug, stimulant drugs were most frequently used (7.8% of all persons newly admitted: 4.9% of males and 33.2% of females), followed by organic solvents (11.7% of all persons newly admitted: 11.6% of males and 12.7% of females). The percentage of those who used drugs including such items was 20.8% (17.8% of males and 47.2% of females), which exceeded the percent distribution by type of offense related to drugs for both males and females Source: Annual Report of Statistics on Correction. (8) Educational level Fig. 4-2-4-10 shows the trends in percent distribution of persons newly admitted to juvenile training schools, by educational level in 2001.The ratio for junior high school graduates has been highest of all, followed by senior high school dropouts, senior high school students, junior high school students.
The percent distribution by gender for junior high school graduates was 42.4% for males and 35.9% for females, followed by 34.8% for males and 34.1% for females of senior high school dropouts, 8.9% for males and 16.6% for females of junior high school students, and 10.4% for males and 11.1% for females of senior high school students. The rate of senior high school students has been on an upward trend consistently since 1996. It was 5.9% (226 persons) in 1995, but has risen to 10.5% (631 persons) in 2001 (Source: Annual Report of Statistics on Correction). Fig. 4-2-4-10 Trends in the percent distribution of the number of persons newly admitted to juvenile training schools, by educational level (9) Foreign juveniles Of those newly admitted to juvenile training schools in 2001, 45 juveniles (43 males, 2 females) were placed in the living guidance course (G2) as foreign nationals who need treatment programs different from those for Japanese nationals. Such figures showed an increase by 7 persons from the previous year. By nationality, Brazilians (40) had the largest share. By type of offense, robbery accounted for the largest share (19 persons, 10 persons in the previous year), followed by larceny (18 persons, 17 persons in the previous year), and Stimulant Drug Control Law violations (4 persons, 3 persons in the previous year). By the history of protective measures, those who had received probationary supervision once accounted for 7 persons, and those who were committed to juvenile training schools accounted for 2 persons. By delinquent groups and use of drugs, etc., those who were involved with local delinquent groups came to 12 persons, and those who were involved with stimulant drugs came to 14 persons (Source: Annual Report of Statistics on Correction).
|
