WHITE PAPER ON CRIME 2018
NOTES
PART 1 Crime Trends
Chapter 1 Penal Code Offenses
Section 1 Overview
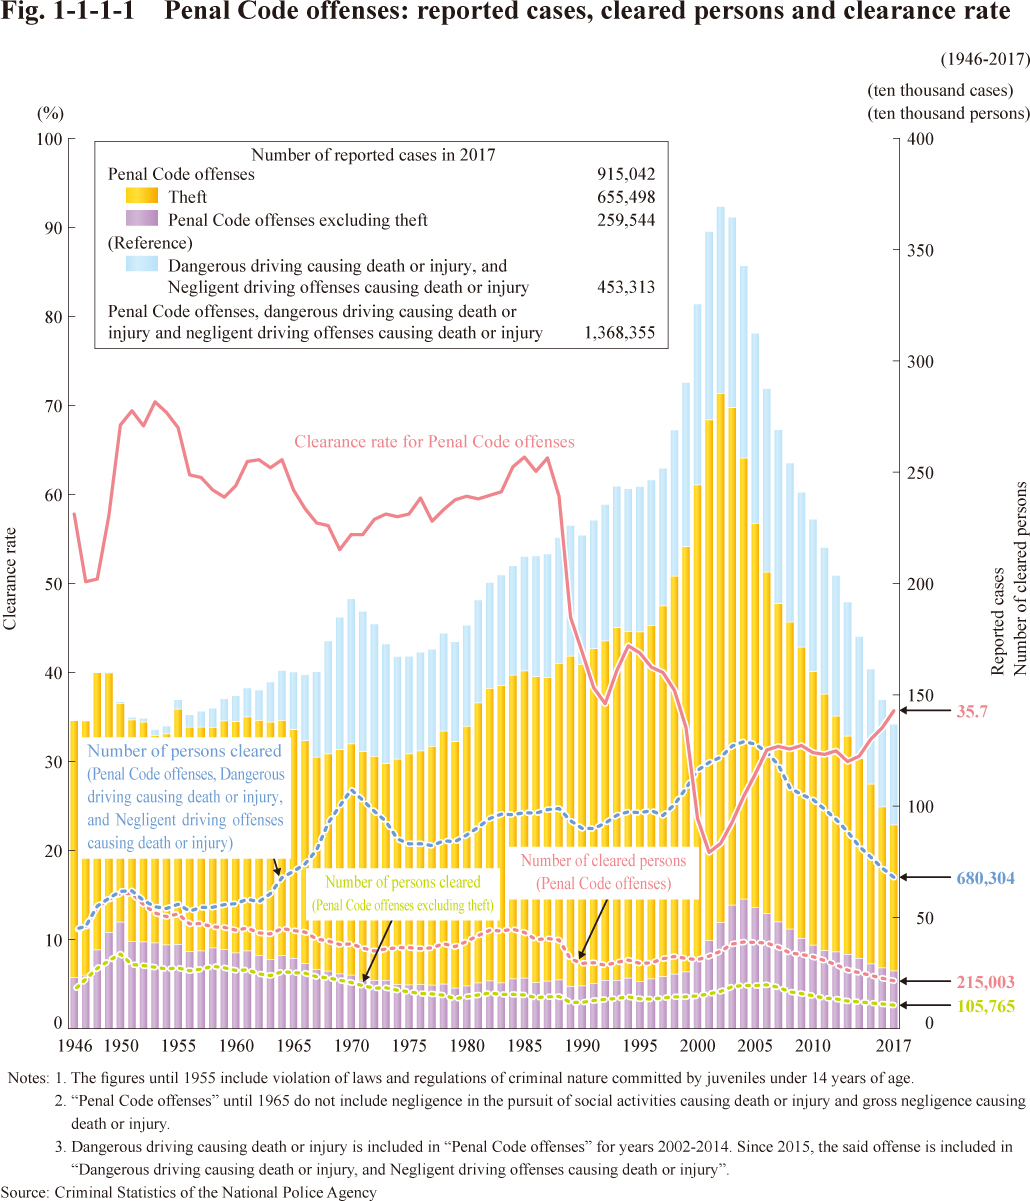 Fig. 1-1-1-1 Penal Code offenses: reported cases, cleared persons and clearance rate
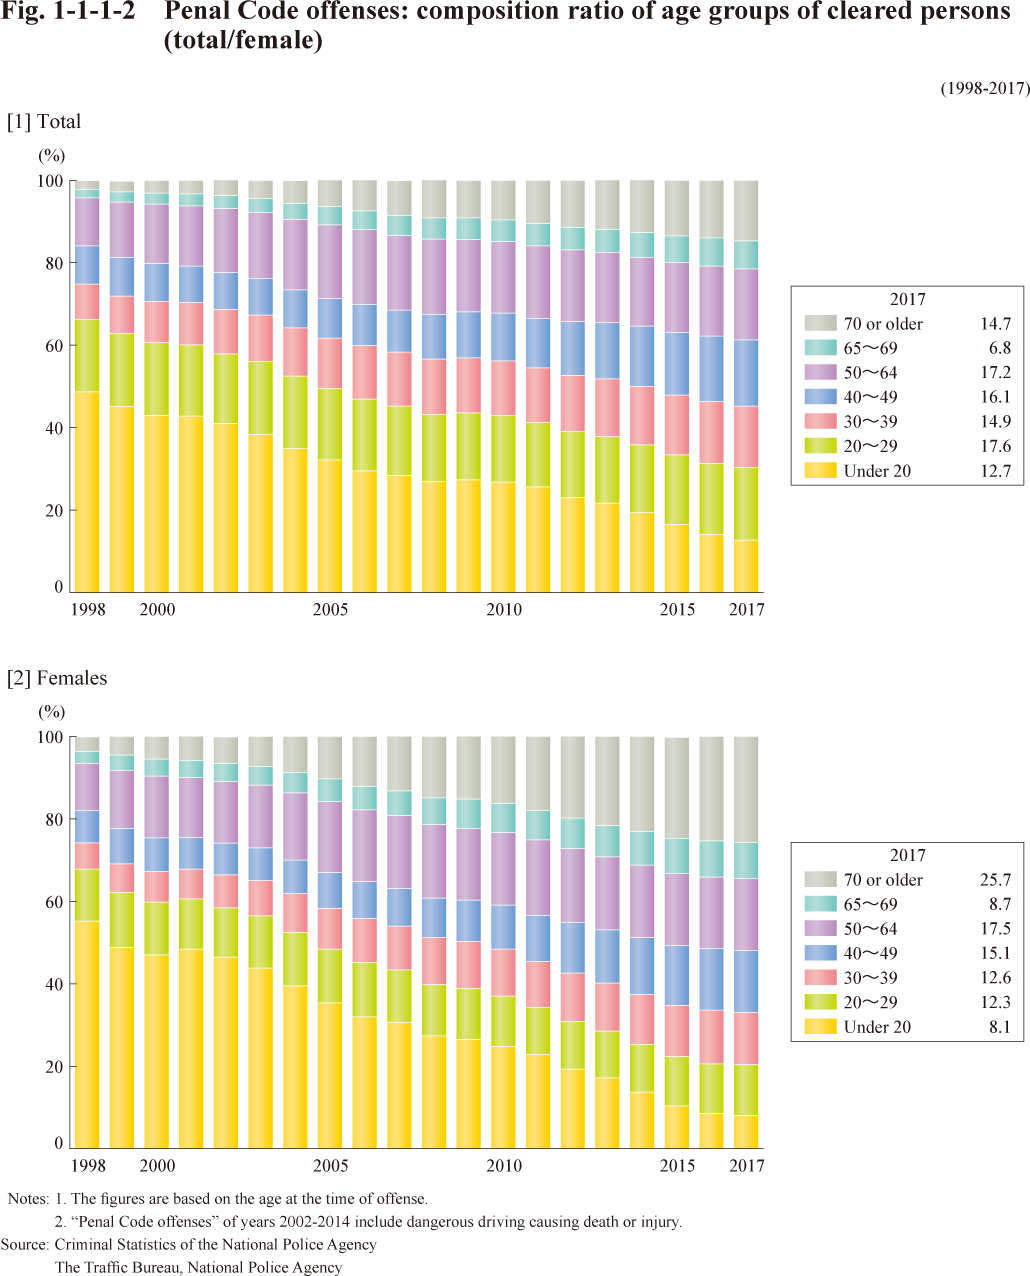 Fig. 1-1-1-2 Penal Code offenses: composition ratio of age groups of cleared persons (total/female)
Section 2 Penal Code Offenses
 Fig. 1-1-2-2 Rape: reported/cleared cases and clearance rate
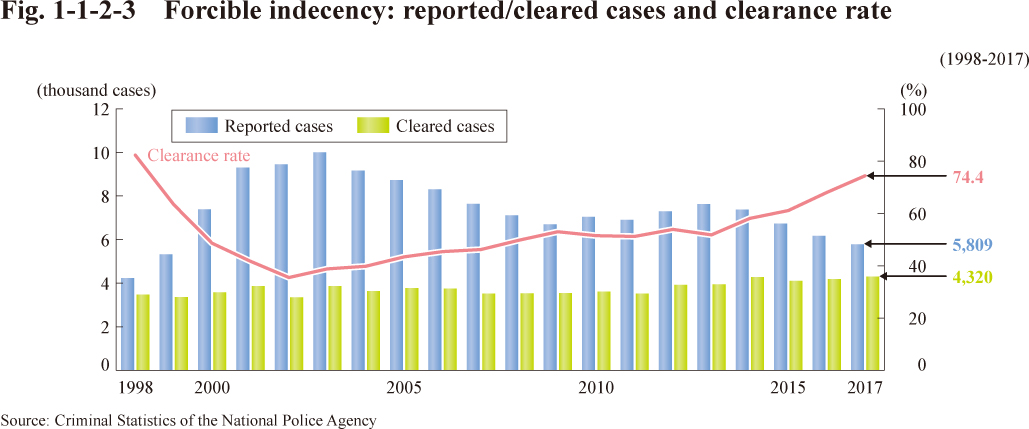 Fig. 1-1-2-3 Forcible indecency: reported/cleared cases and clearance rate
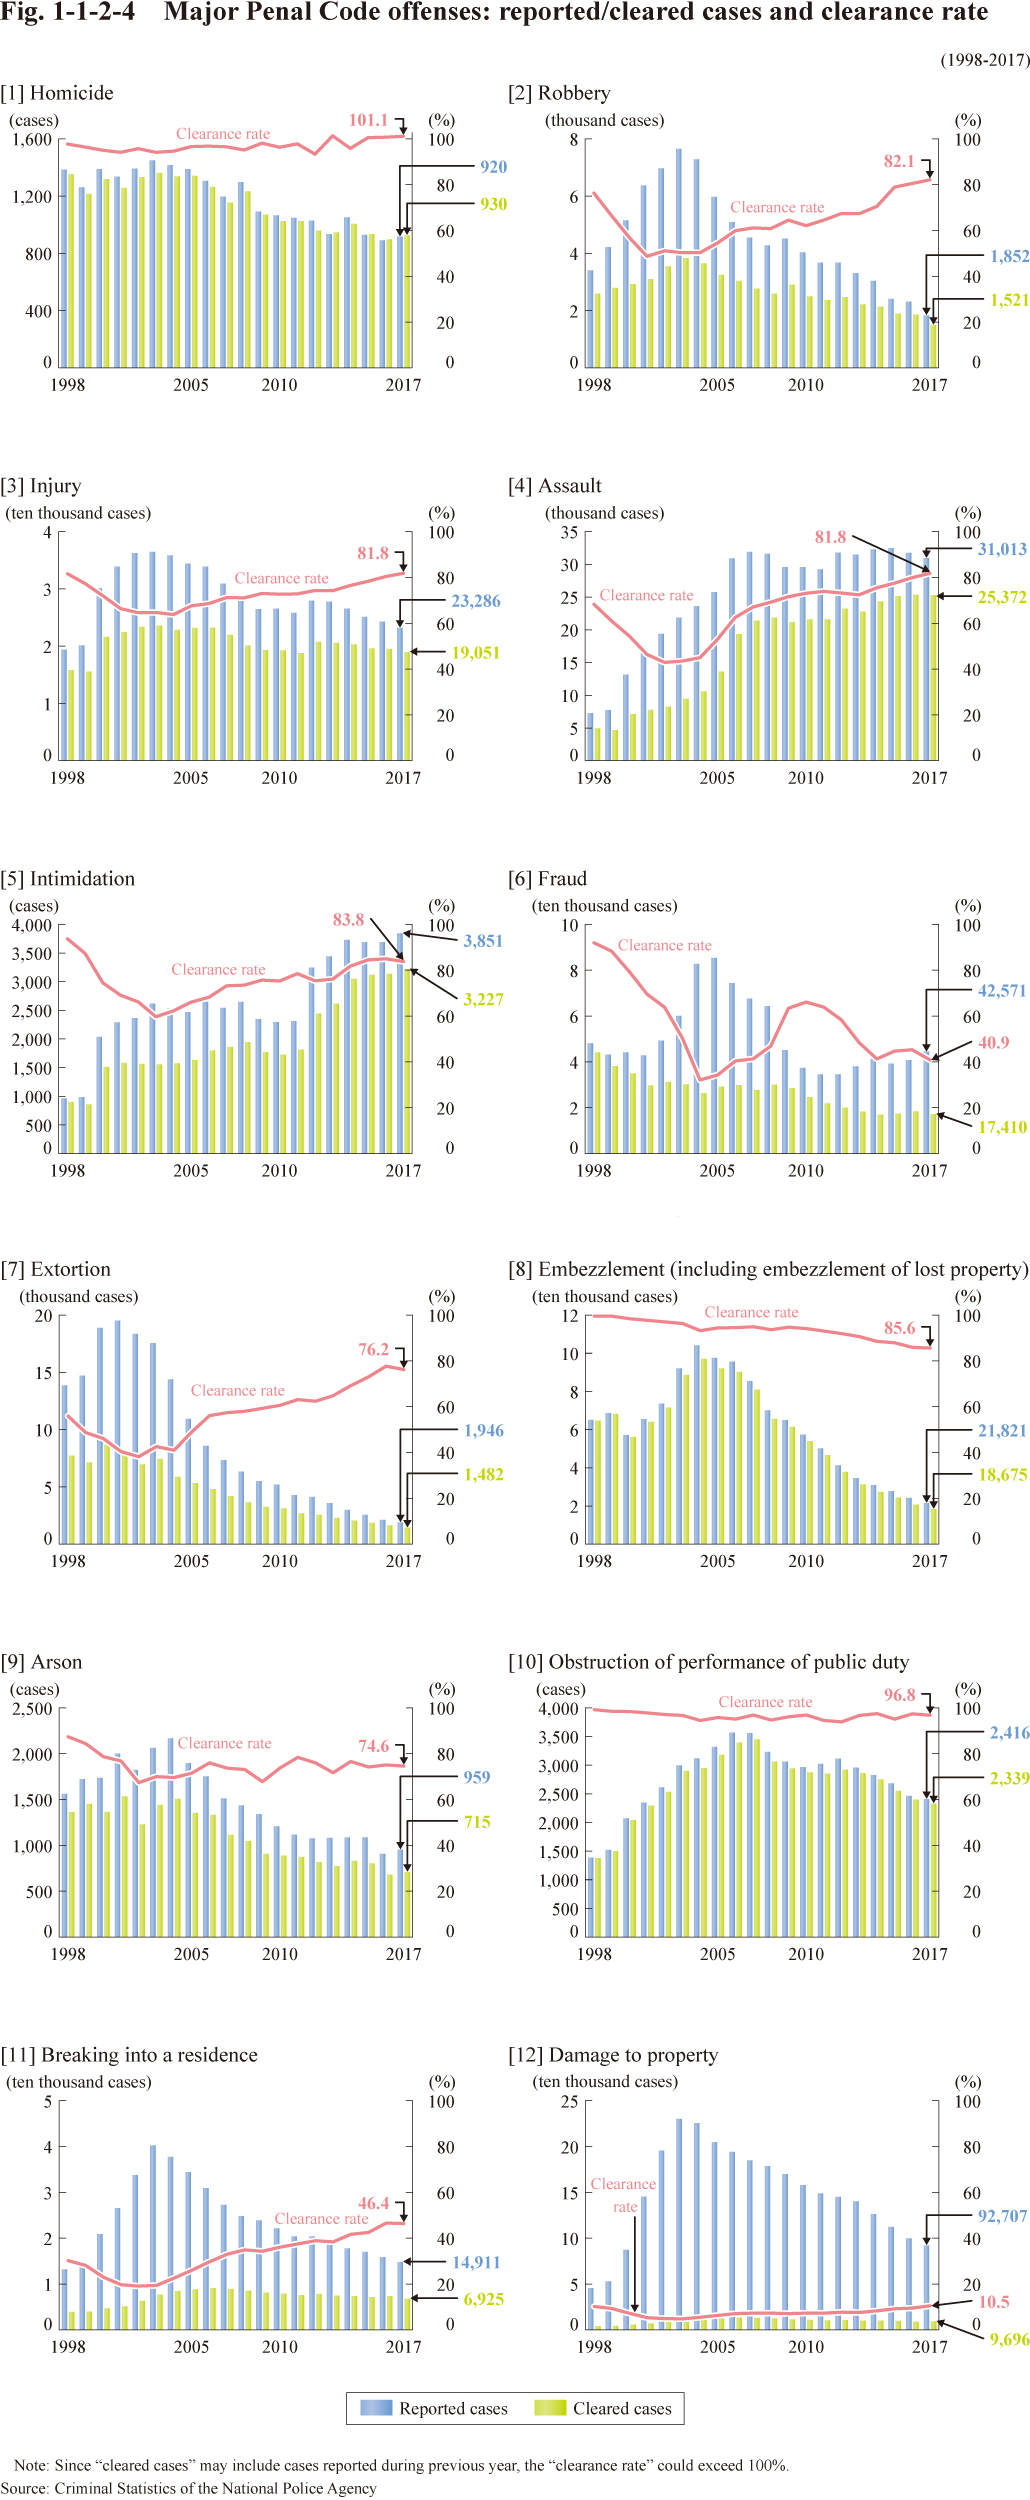 Fig. 1-1-2-4 Major Penal Code offenses: reported/cleared cases and clearance rate
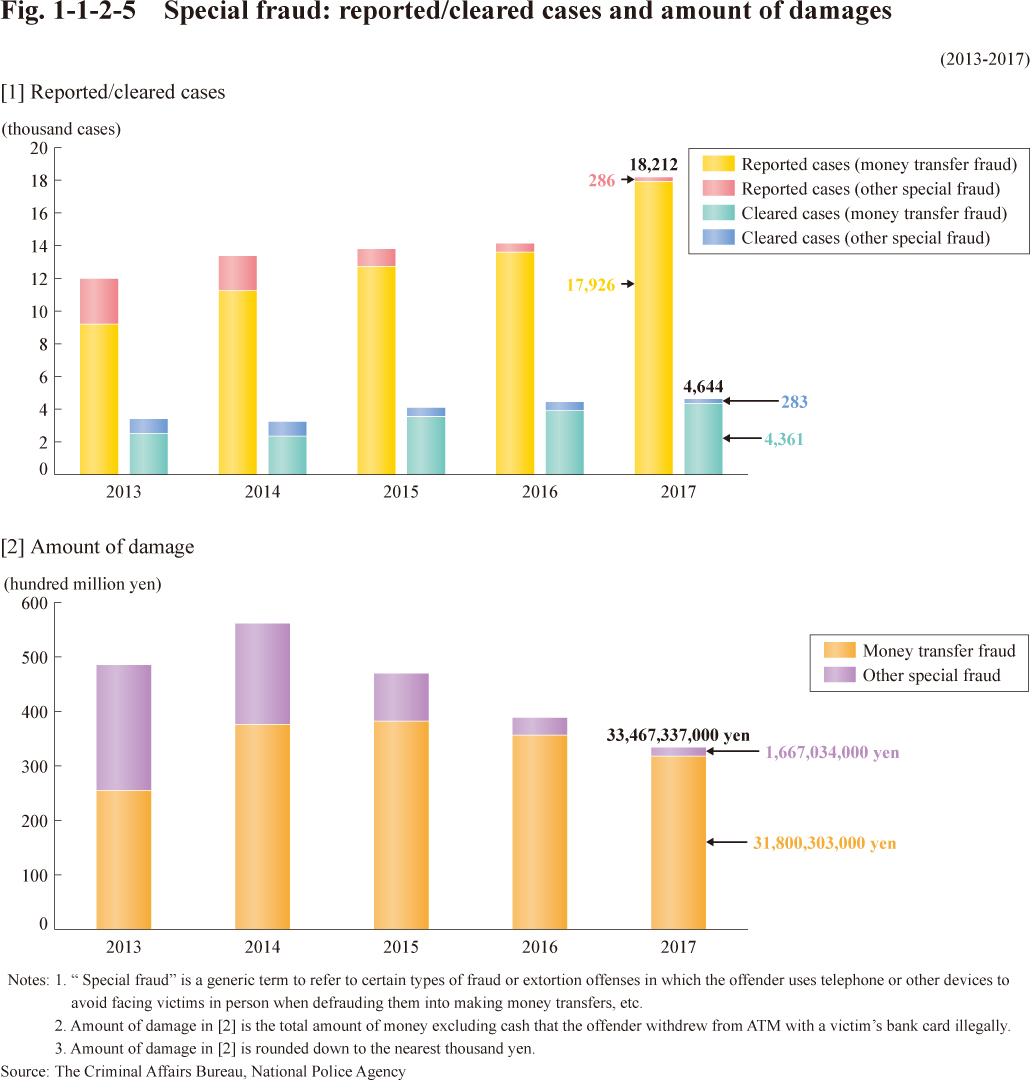 Fig. 1-1-2-5 Special fraud: reported/cleared cases and amount of damages
Chapter 2 Special Acts Offenses
Section 1 Overview
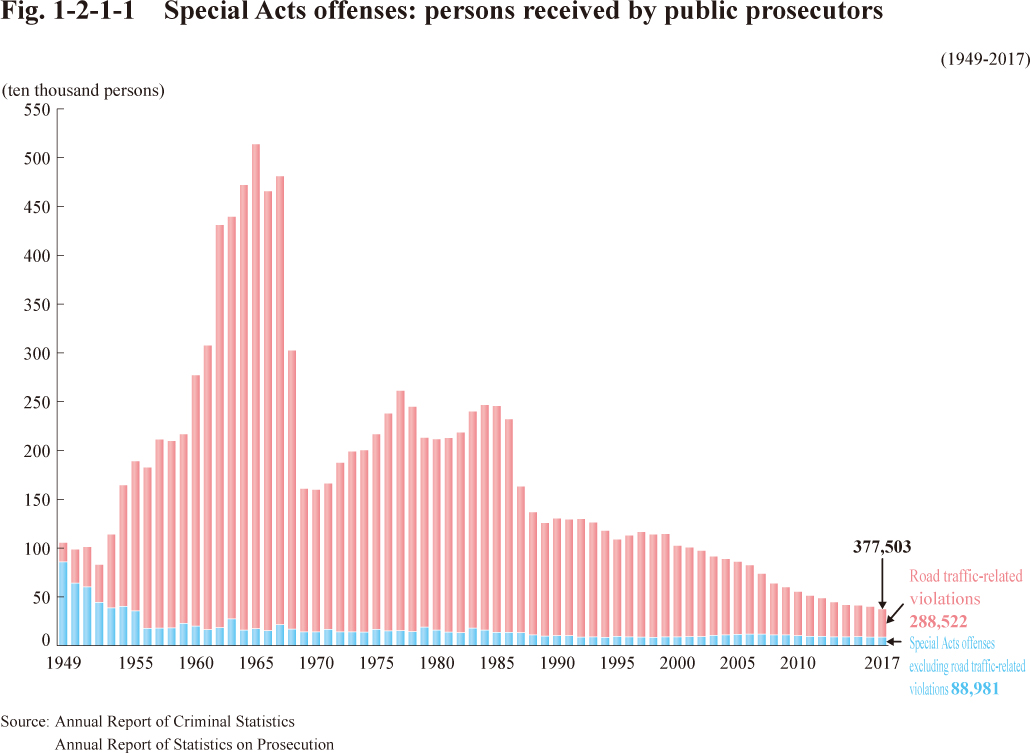 Fig. 1-2-1-1 Special Acts offenses: persons received by public prosecutors
Section 2 Special Acts Offenses in Categories
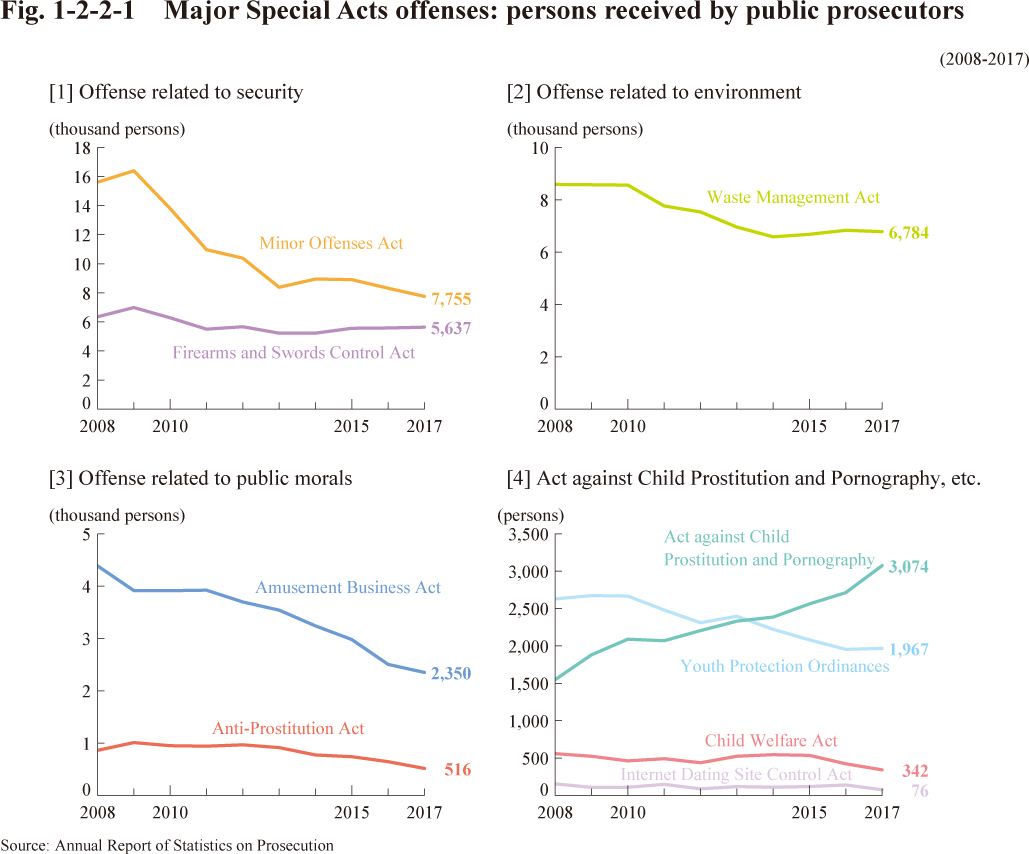 Fig. 1-2-2-1 Major Special Acts offenses: persons received by public prosecutors
PART 2 Treatment of Offenders
Chapter 1 Overview
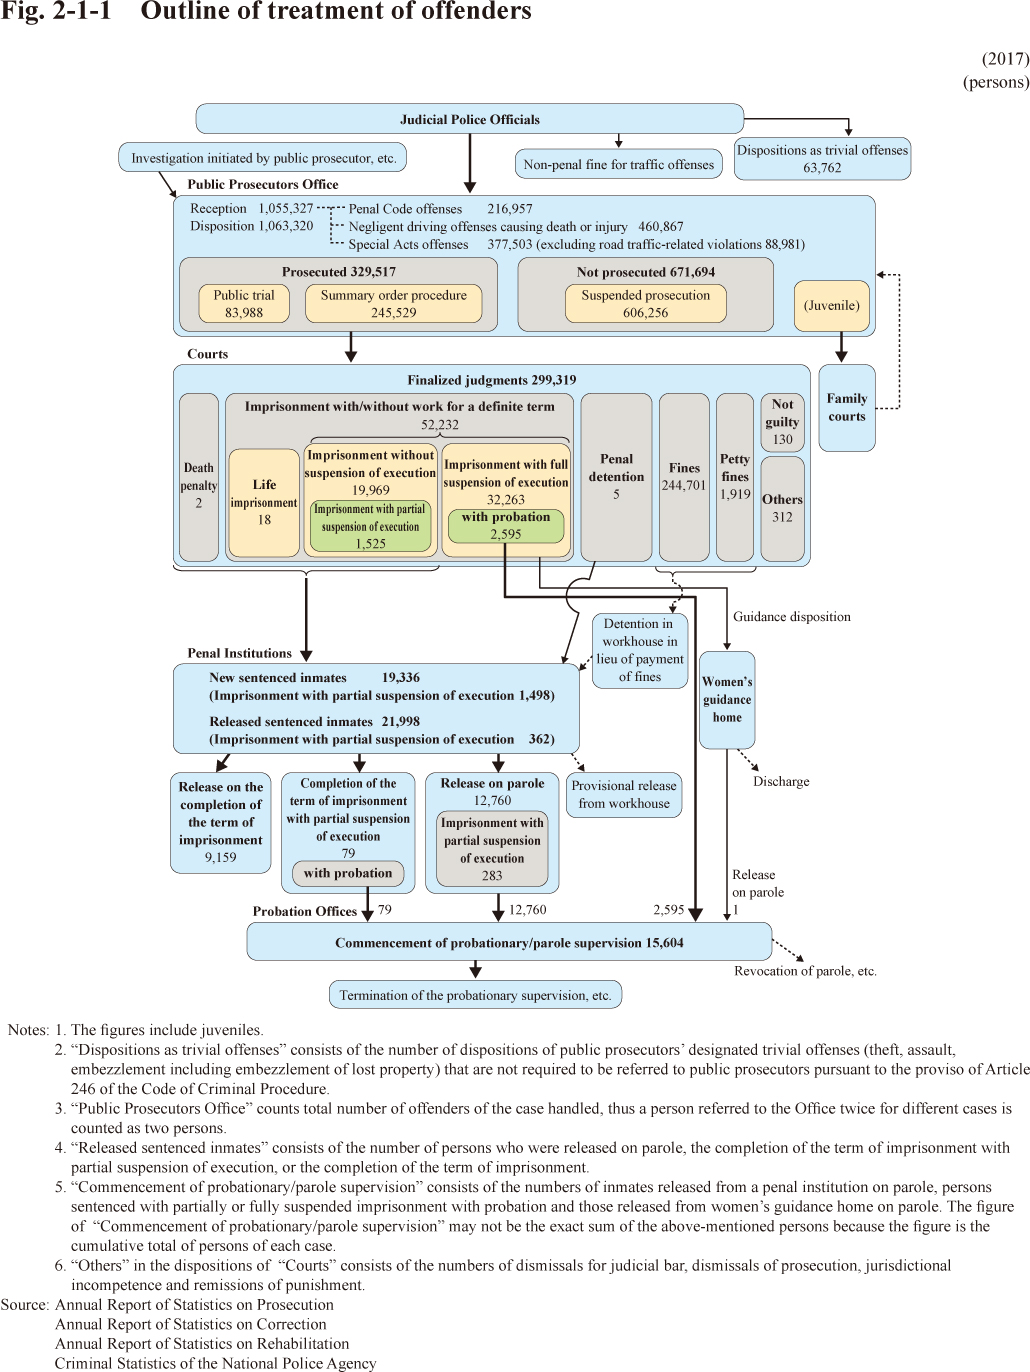 Fig. 2-1-1 Outline of treatment of offenders
Chapter 2 Prosecution
Section 1 Receptions
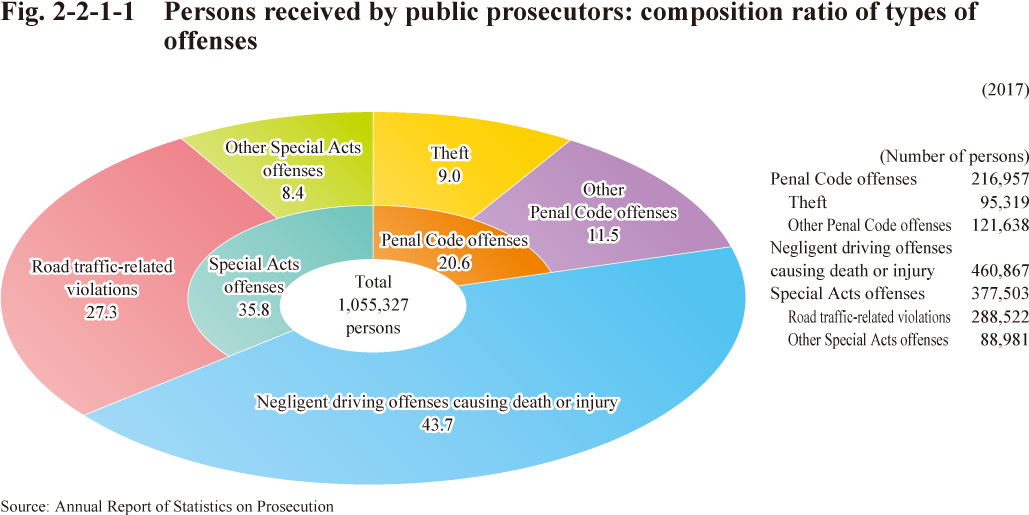 Fig. 2-2-1-1 Persons received by public prosecutors: composition ratio of types of offenses
Section 2 Dispositions
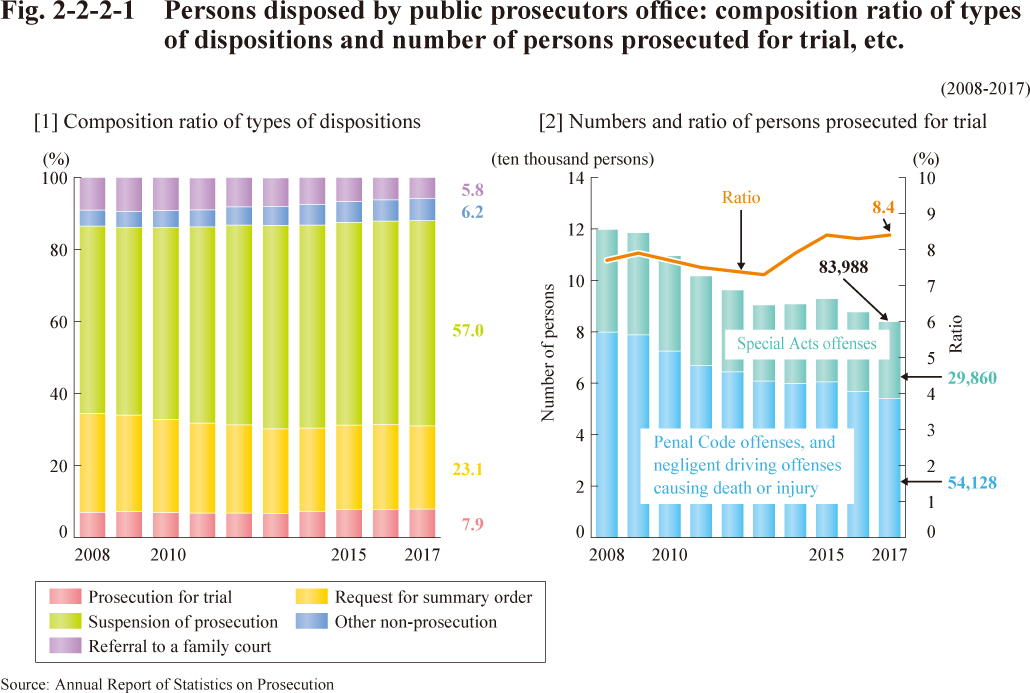
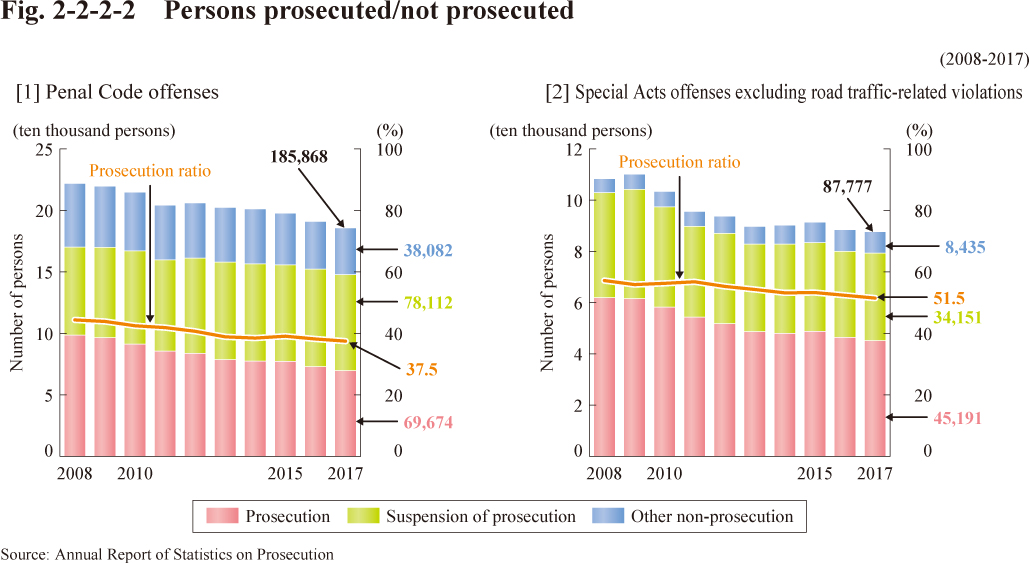 Fig. 2-2-2-2 Persons prosecuted/not prosecuted
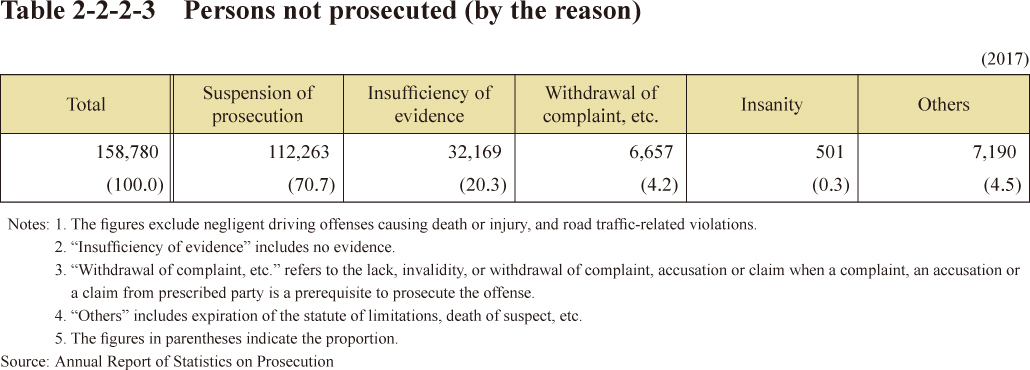 Table 2-2-2-3 Persons not prosecuted (by the reason)
Chapter 3 Courts
Section 1 Finalized Judgment
 Table 2-3-1-1 Persons whose cases have been finalized (by types of judgments)
Section 2 Courts of First Instance
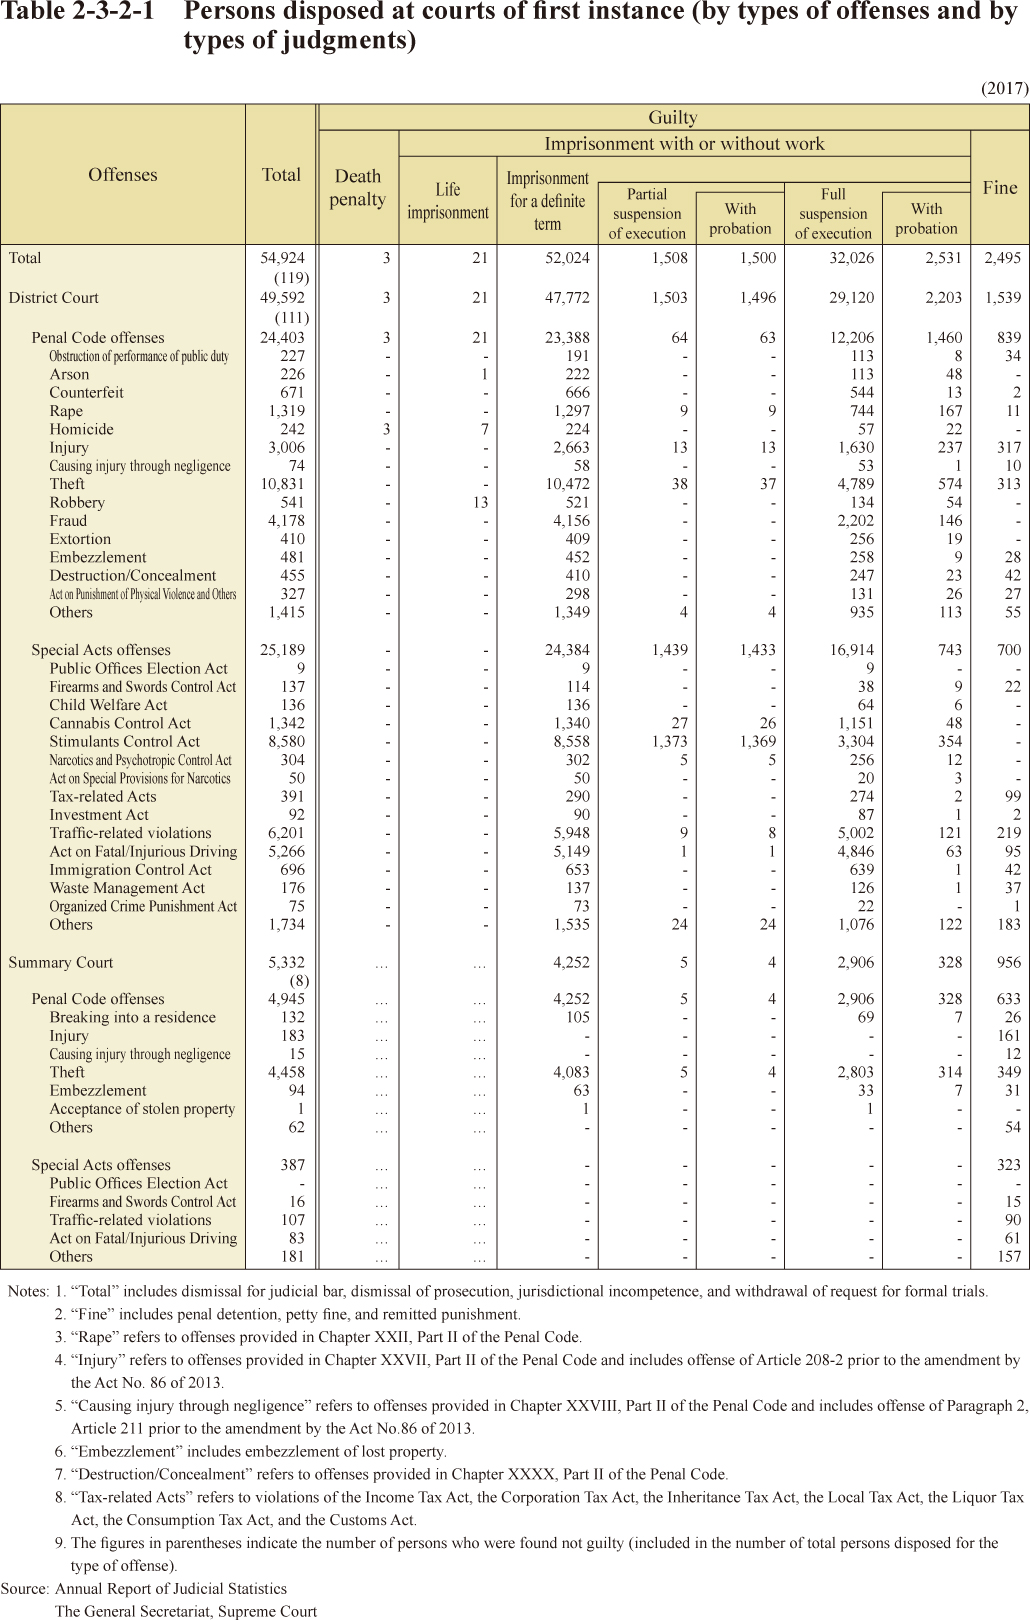
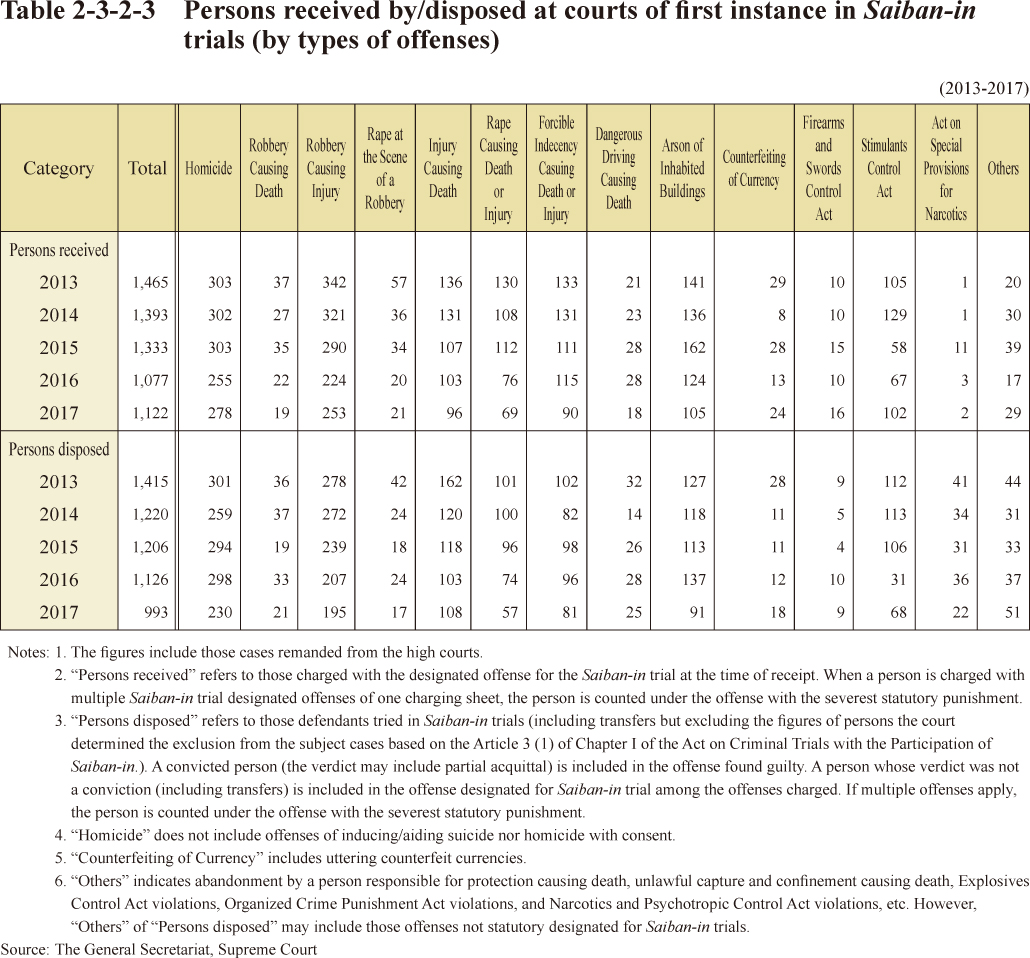
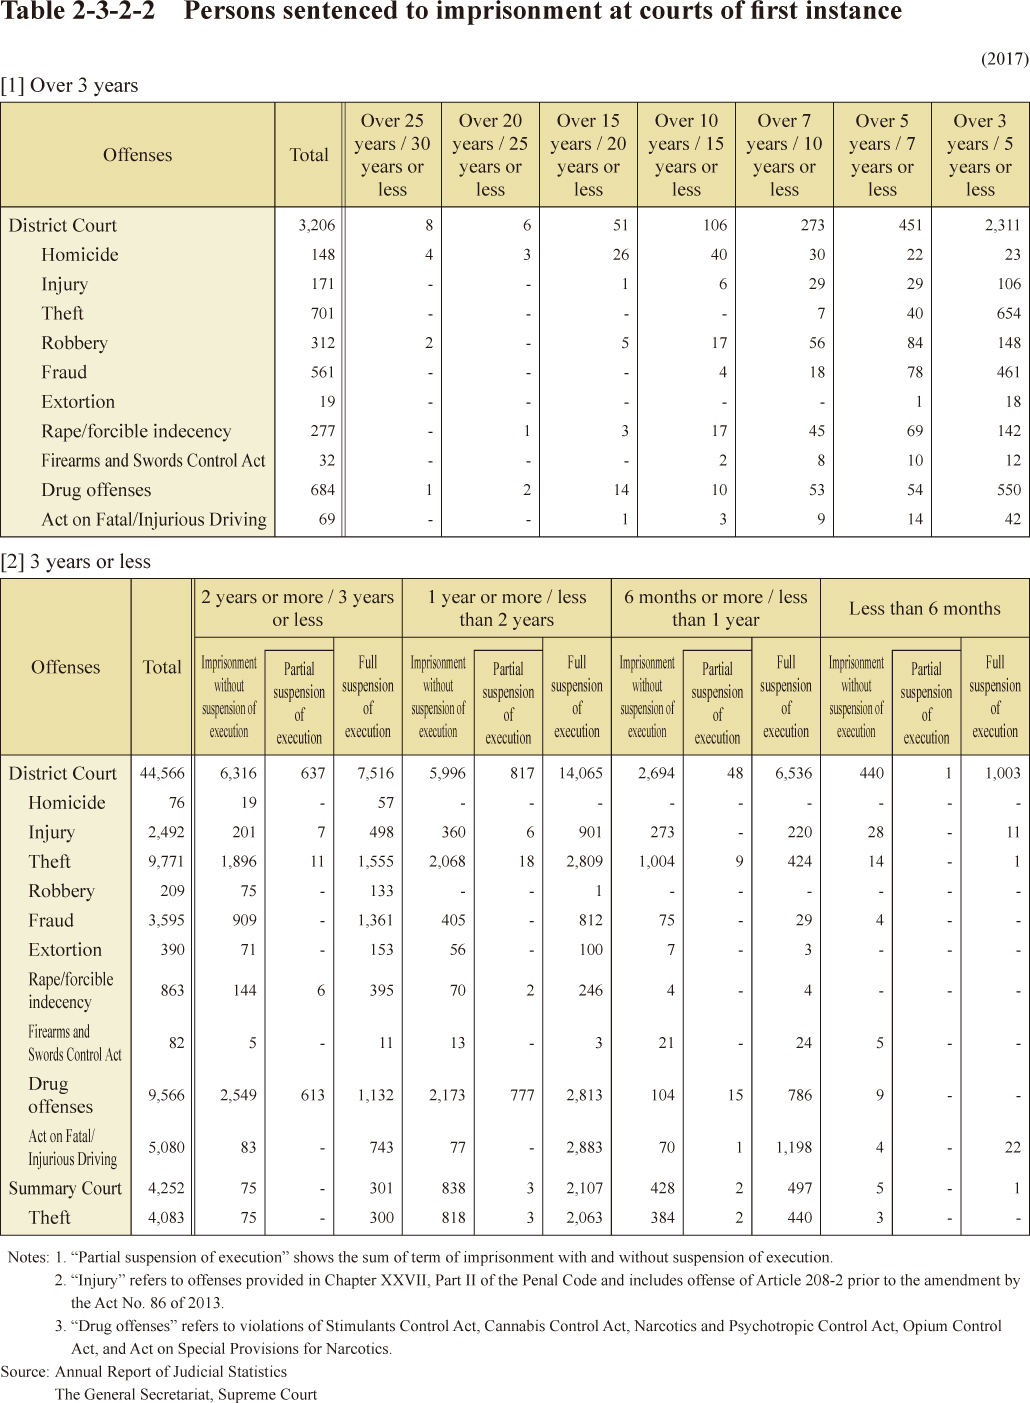 Table 2-3-2-2 Persons sentenced to imprisonment at courts of first instance
Section 3 Appeals
Chapter 4 Institutional Corrections of Adult Offenders
Section 1 Inmates in Penal Institutions
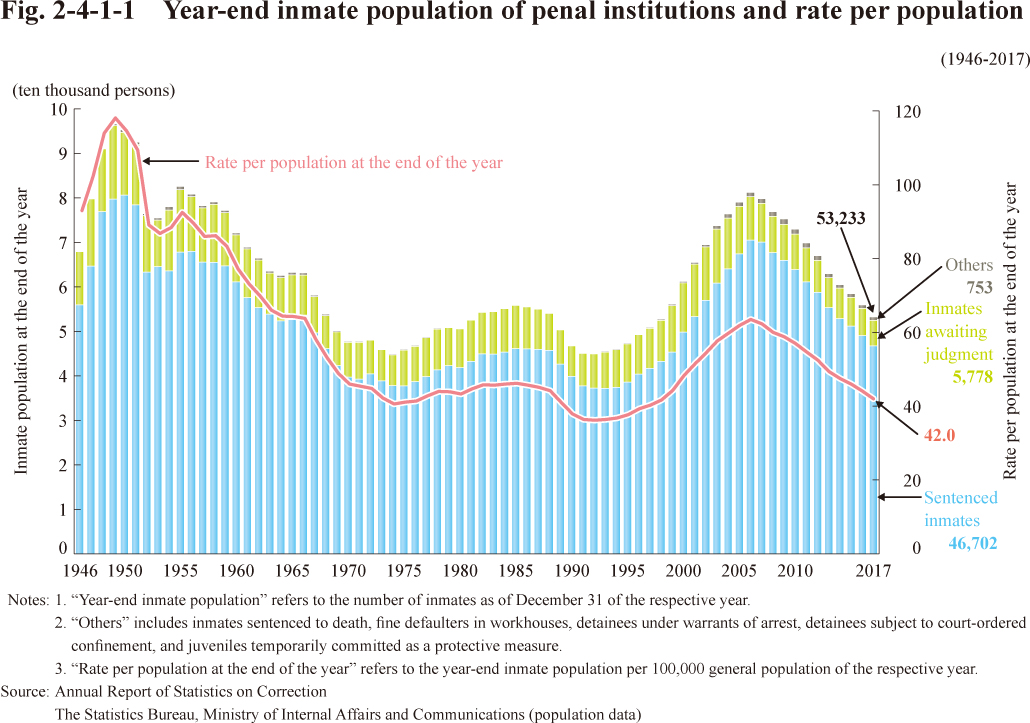 Fig. 2-4-1-1 Year-end inmate population of penal institutions and rate per population
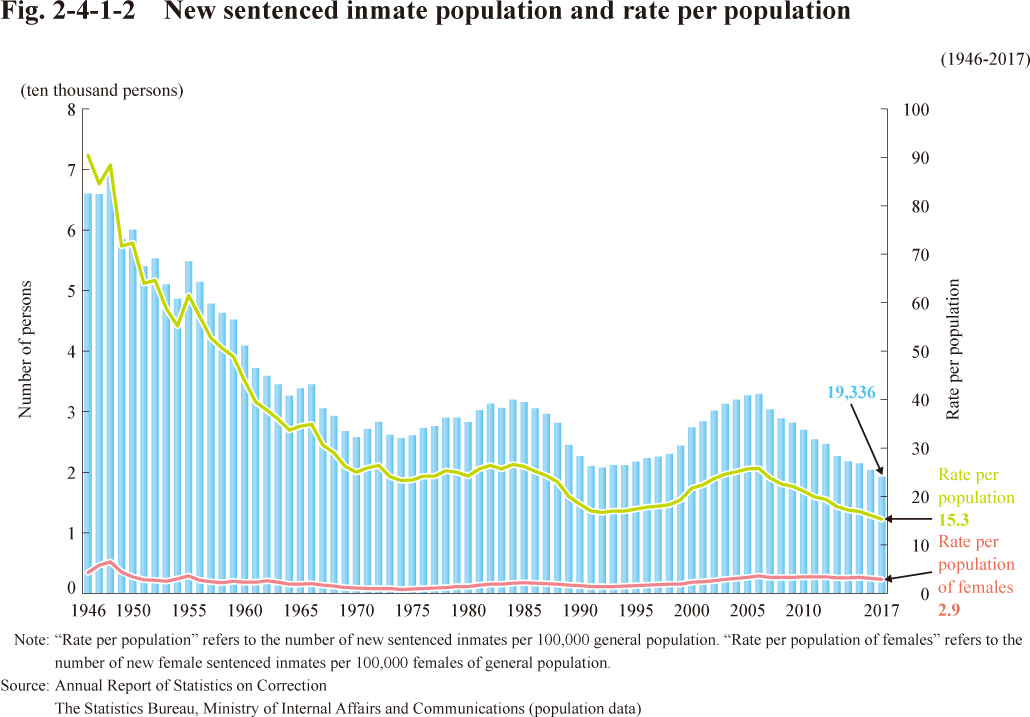 Fig. 2-4-1-2 New sentenced inmate population and rate per population
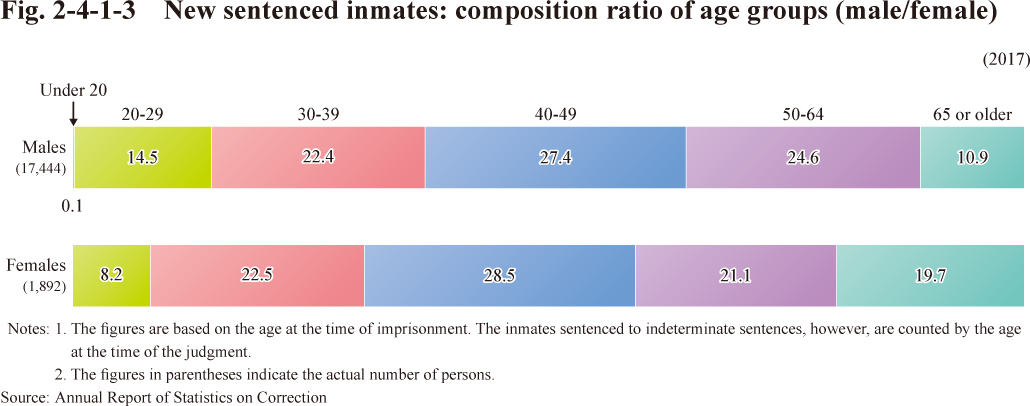 Fig. 2-4-1-3 New sentenced inmates: composition ratio of age groups (male/female)
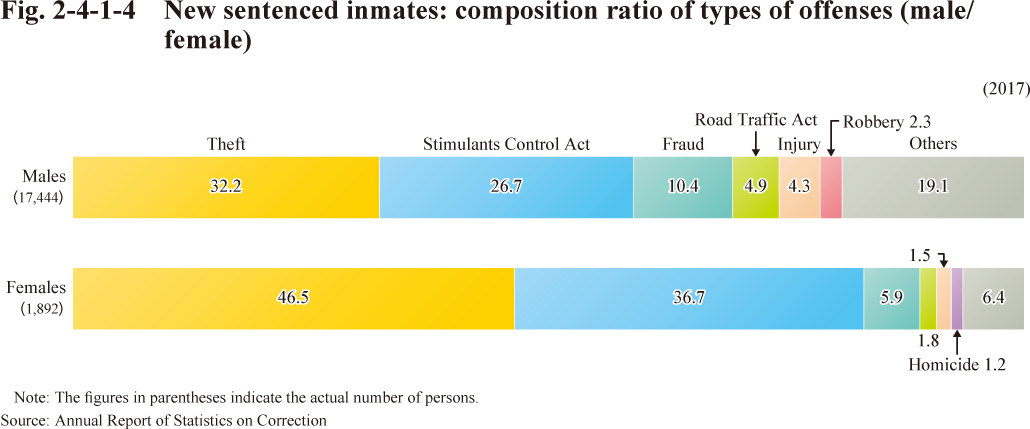 Fig. 2-4-1-4 New sentenced inmates: composition ratio of types of offenses (male/female)
Section 2 Treatment of Sentenced Inmates
 Table 2-4-2-1 Sentenced inmates by treatment indexes
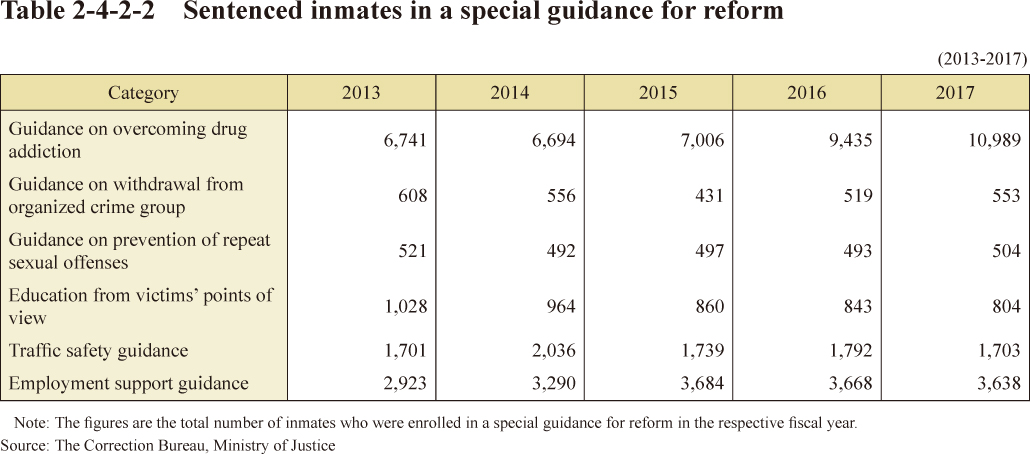 Table 2-4-2-2 Sentenced inmates in a special guidance for reform
Chapter 5 Rehabilitation Services
Section 1 Parole
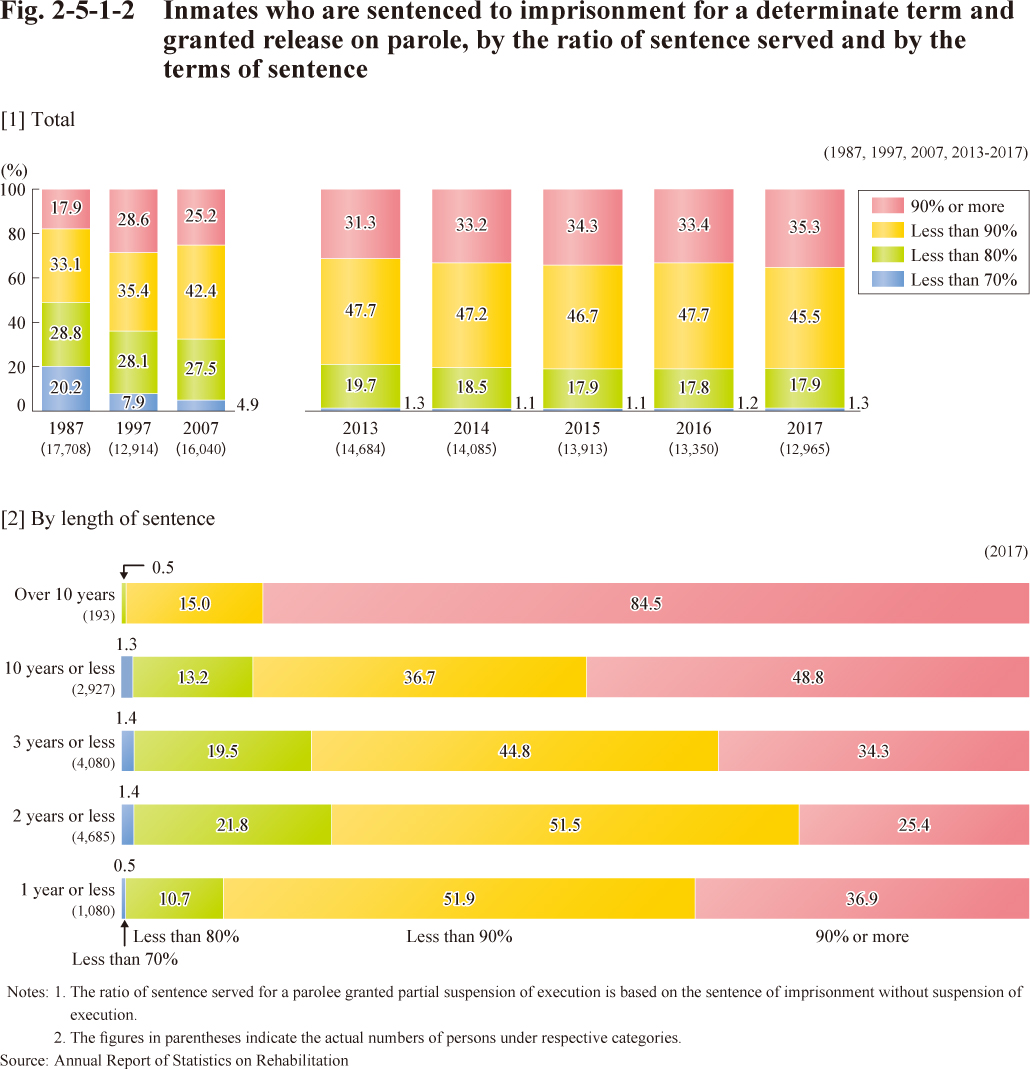
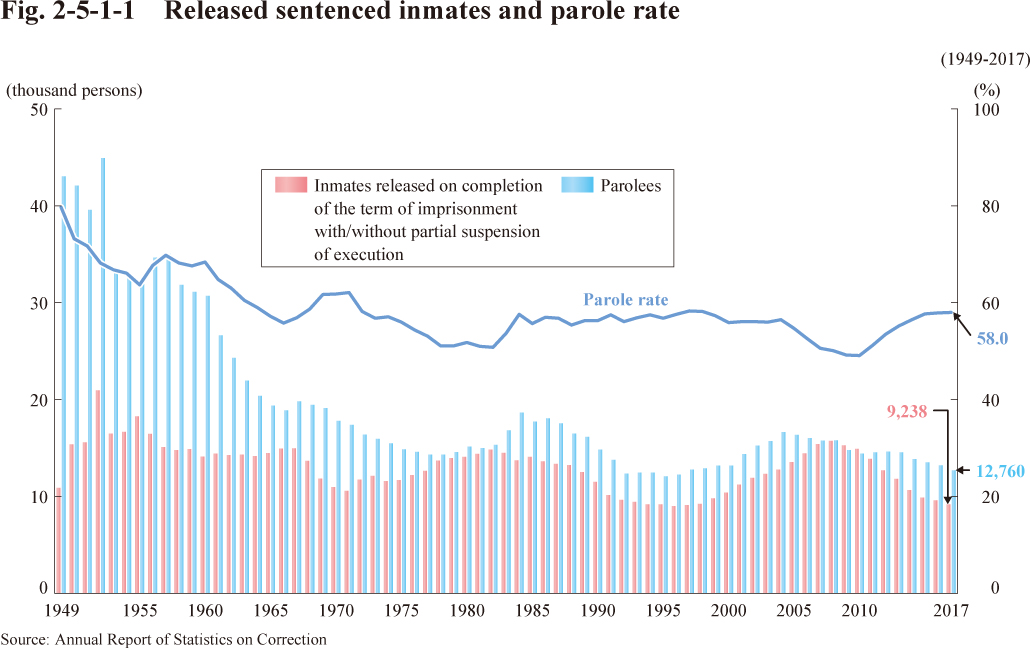 Fig. 2-5-1-1 Released sentenced inmates and parole rate
Section 2 Probation/Parole Supervision
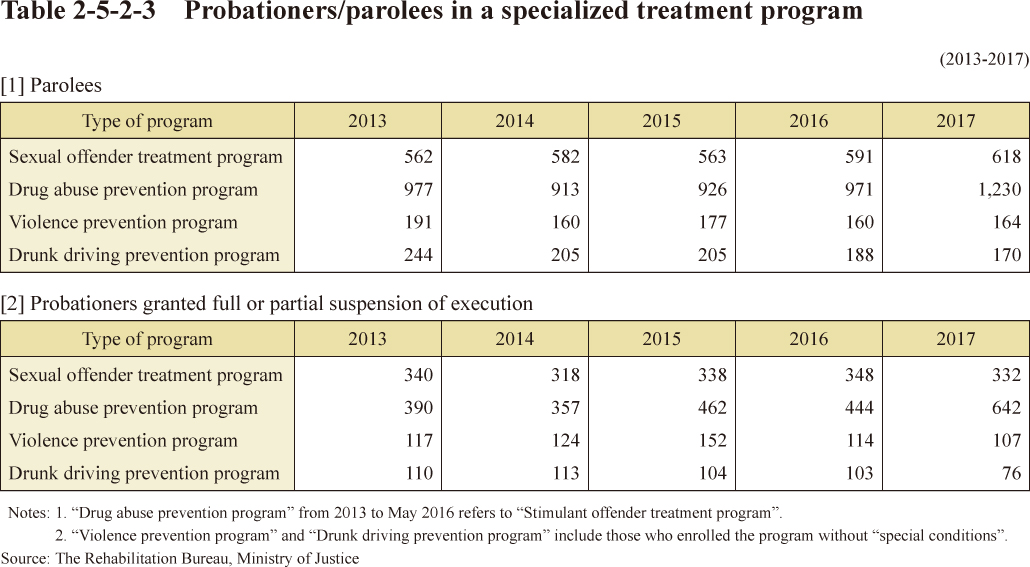 Table 2-5-2-3 Probationers/parolees in a specialized treatment program
Section 3 Volunteer Probation Officers and Halfway Houses
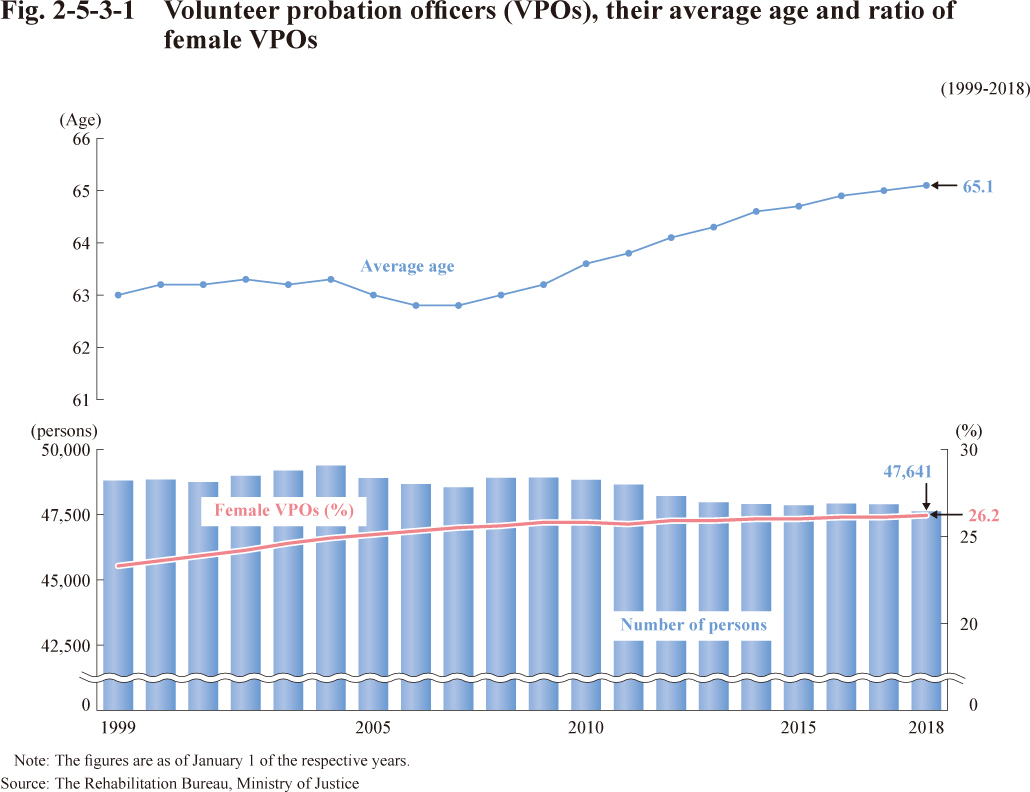 Fig. 2-5-3-1 Volunteer probation officers (VPOs), their average age and ratio of female VPOs
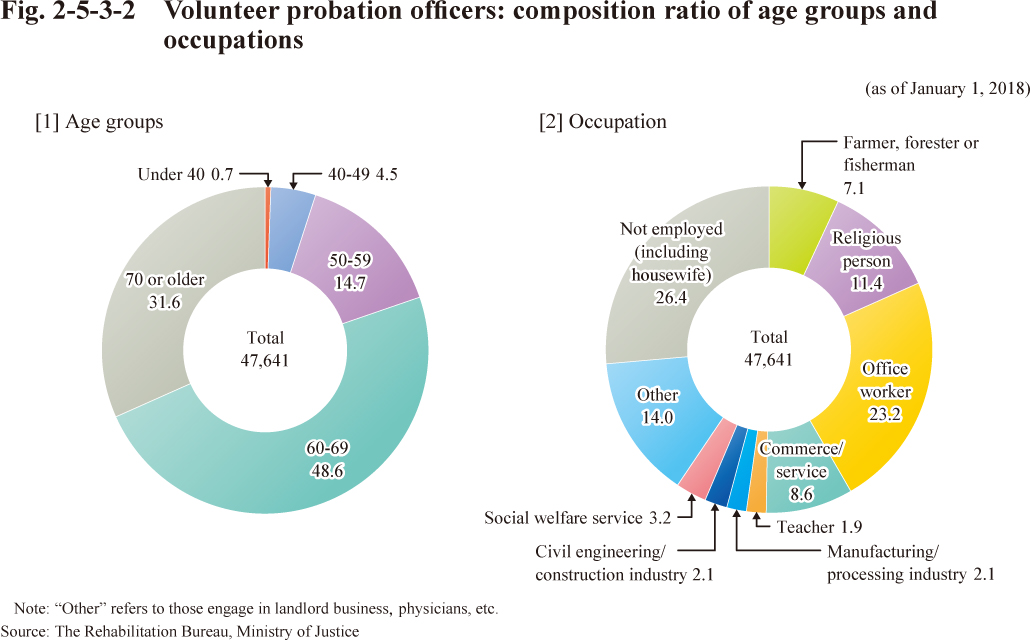 Fig. 2-5-3-2 Volunteer probation officers: composition ratio of age groups and occupations
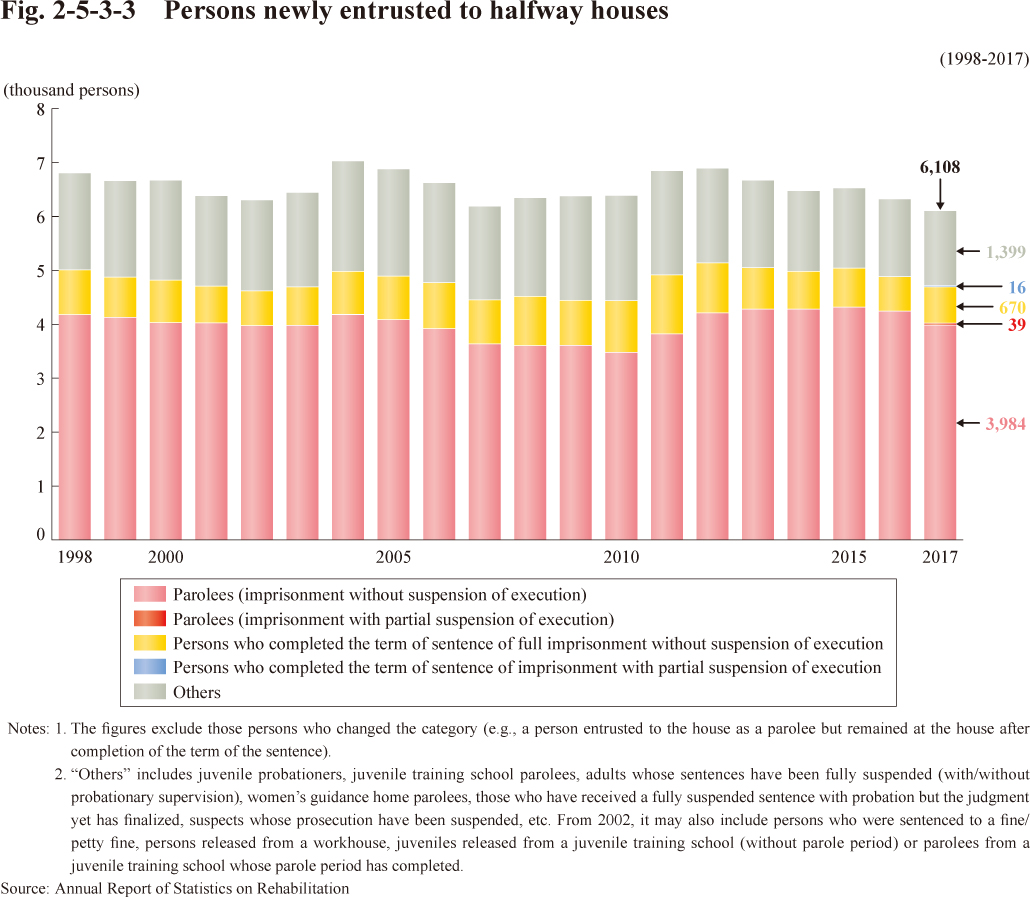 Fig. 2-5-3-3 Persons newly entrusted to halfway houses
PART 3 Trends in Juvenile Delinquencies and Treatment of Juvenile Delinquents
Chapter 1 Trends in Juvenile Delinquencies
Section 1 Penal Code Offenses Committed by Juveniles
Section 2 Special Acts Offenses Committed by Juveniles
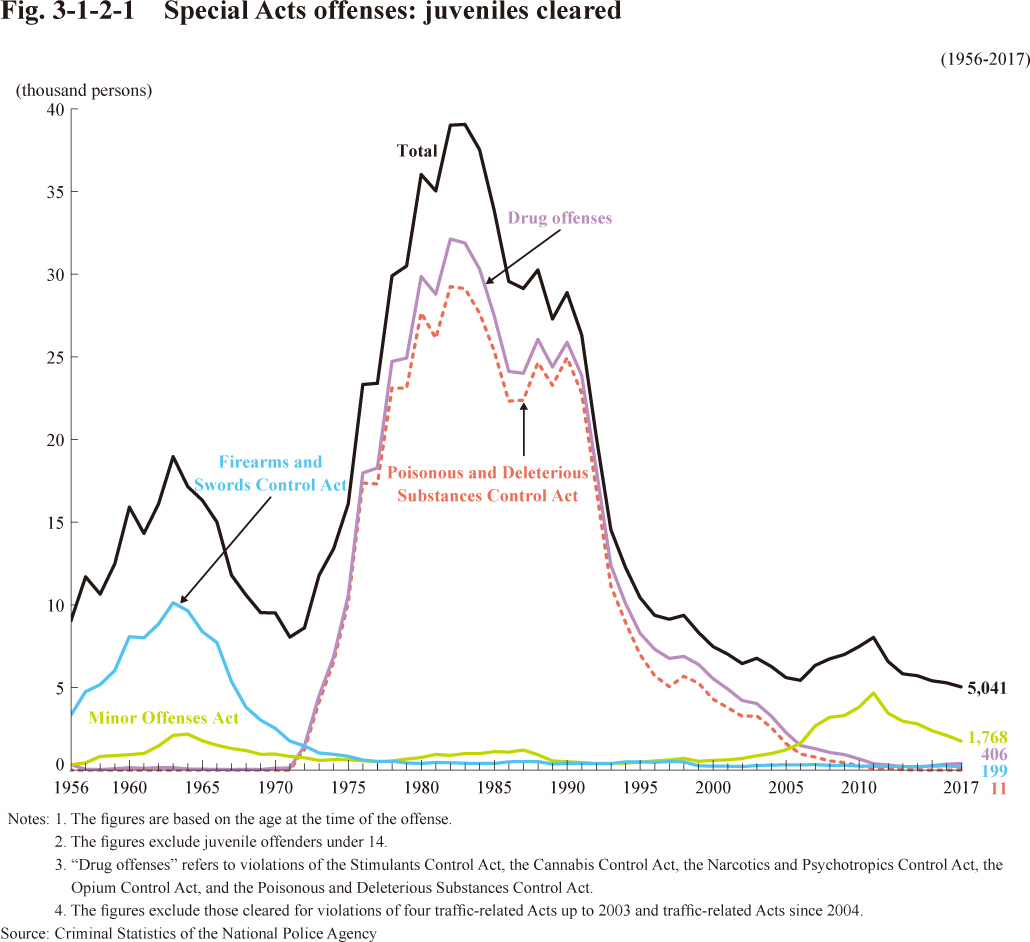 Fig. 3-1-2-1 Special Acts offenses: juveniles cleared
Chapter 2 Treatment of Juvenile Delinquents
Section 1 Overview
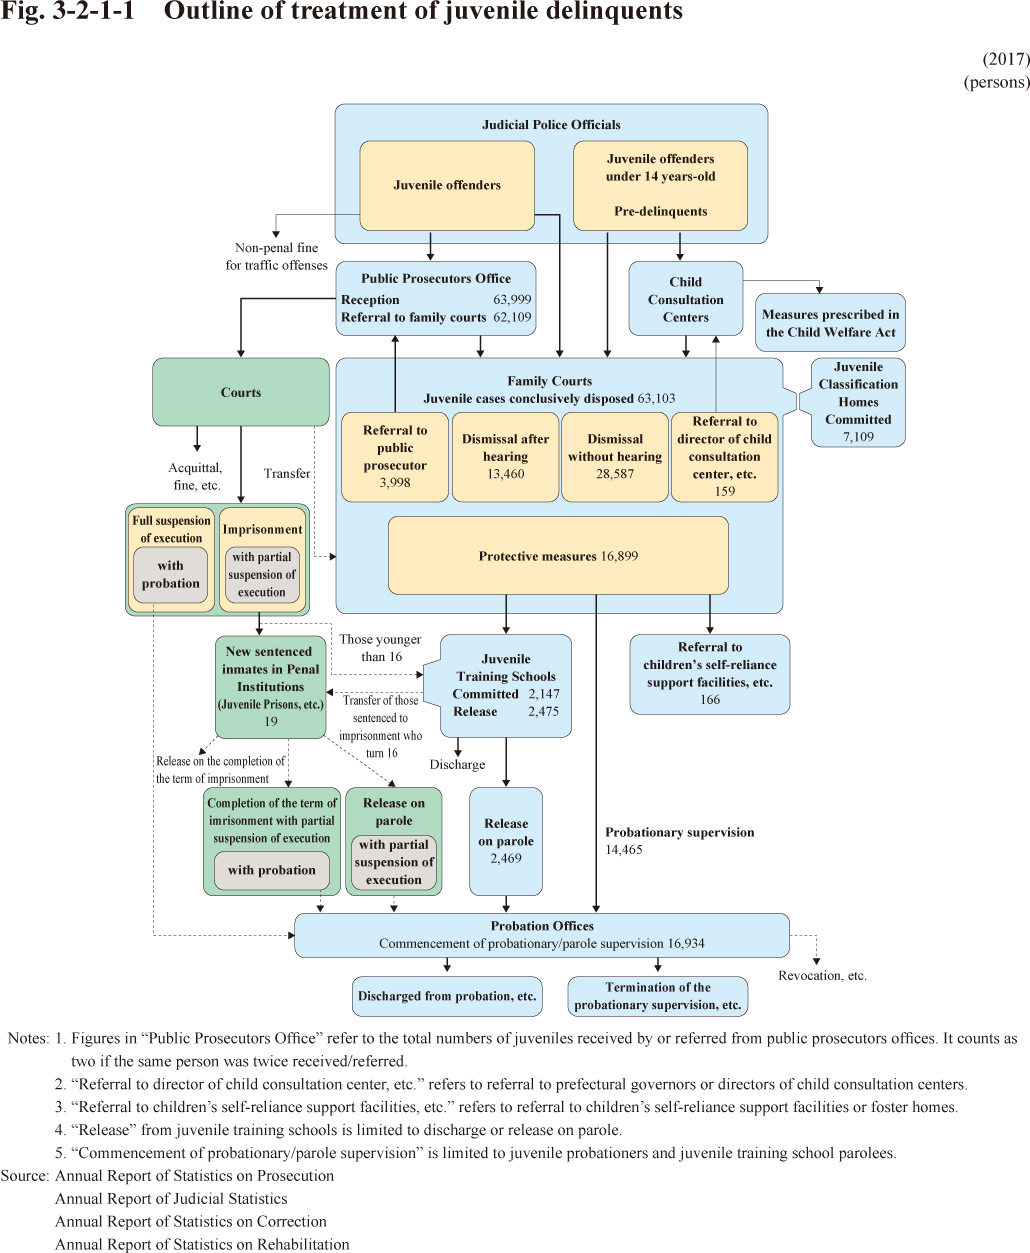 Fig. 3-2-1-1 Outline of treatment of juvenile delinquents
Section 2 Prosecution / Courts
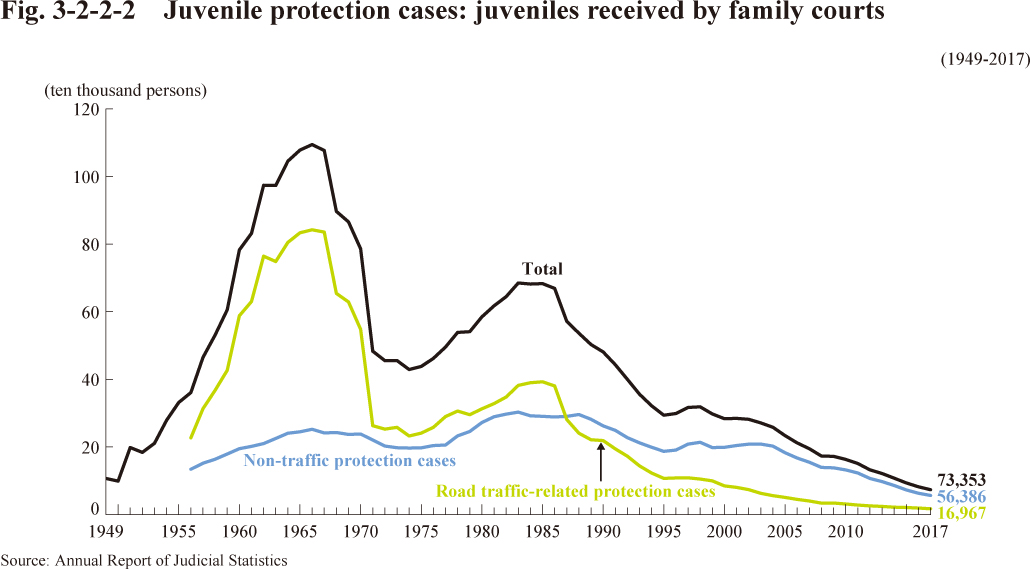 Fig. 3-2-2-2 Juvenile protection cases: juveniles received by family courts
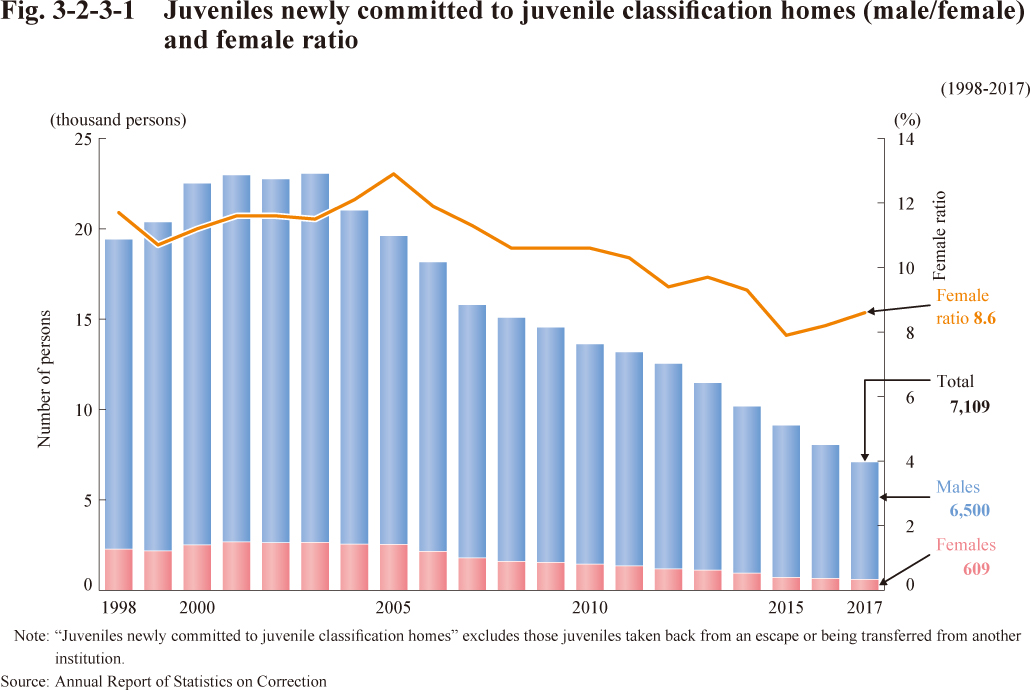
Section 3 Juvenile Classification Homes
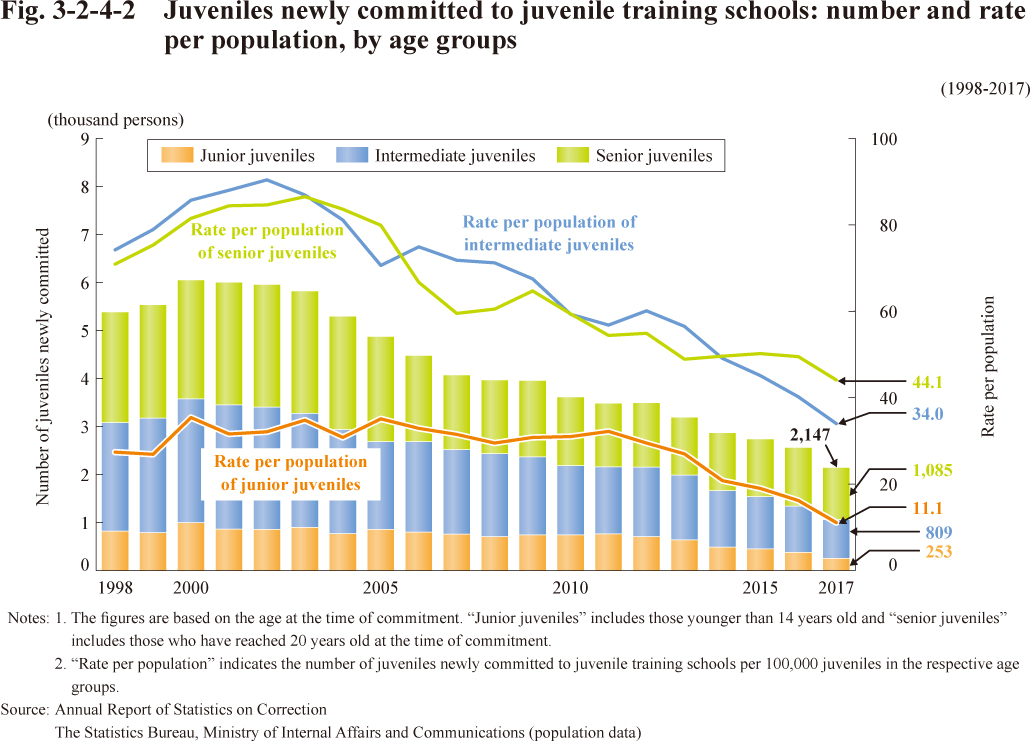
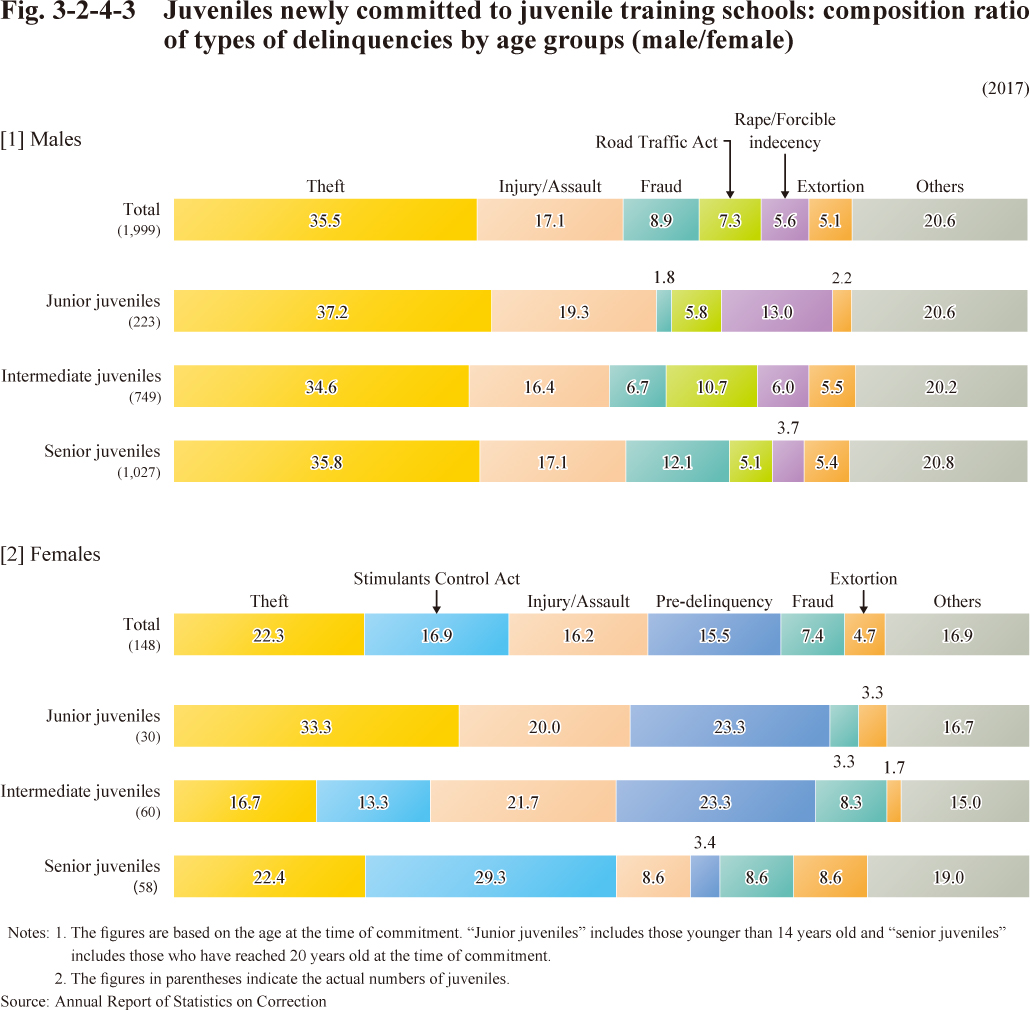
Section 4 Juvenile Training Schools
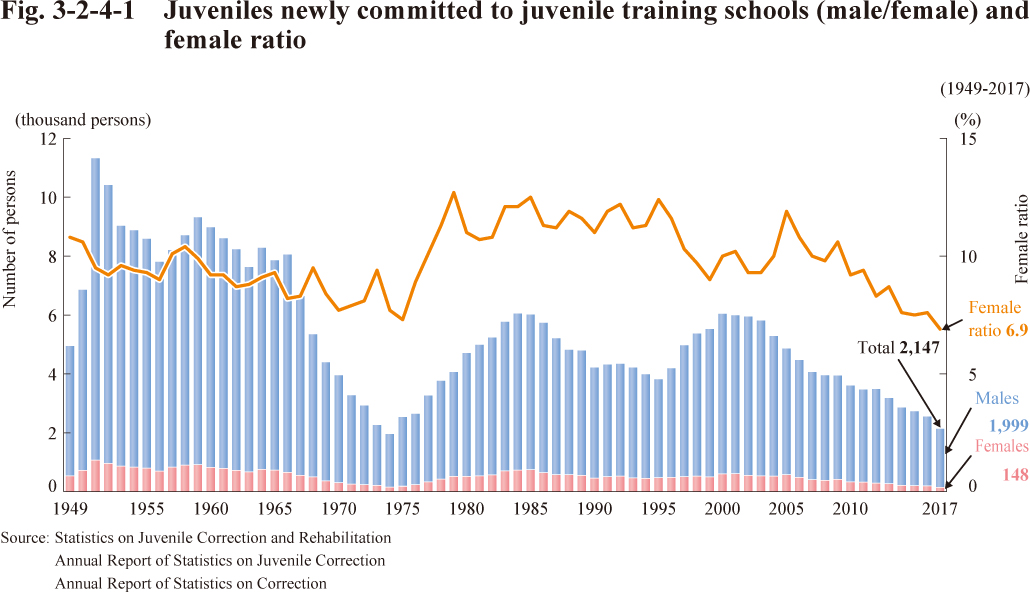 Fig. 3-2-4-1 Juveniles newly committed to juvenile training schools (male/female) and female ratio
Section 5 Probation/Parole Supervision for Juveniles
 Fig. 3-2-5-1 Juveniles placed under probation/parole supervision
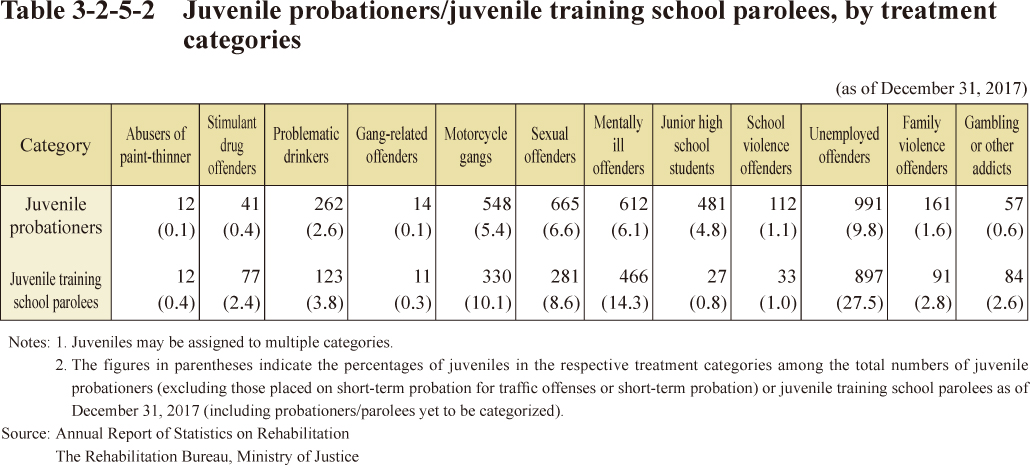 Table 3-2-5-2 Juvenile probationers/juvenile training school parolees, by treatment categories
Chapter 3 Criminal Procedure for Juveniles
PART 4 Specific Types of Offenses / Offenders
Chapter 1 Traffic Offenses
Section 1 Occurrence of Traffic Accident
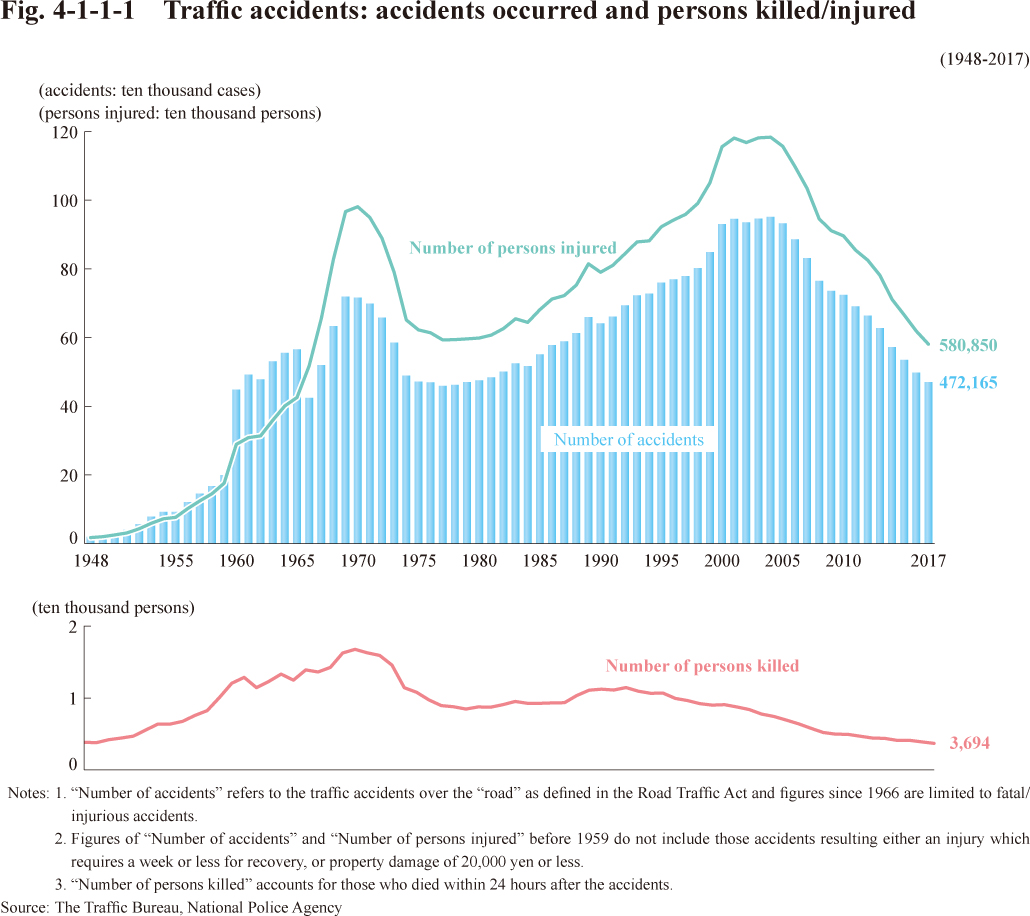 Fig. 4-1-1-1 Traffic accidents: accidents occurred and persons killed/injured
Section 2 Road Traffic-related Violations
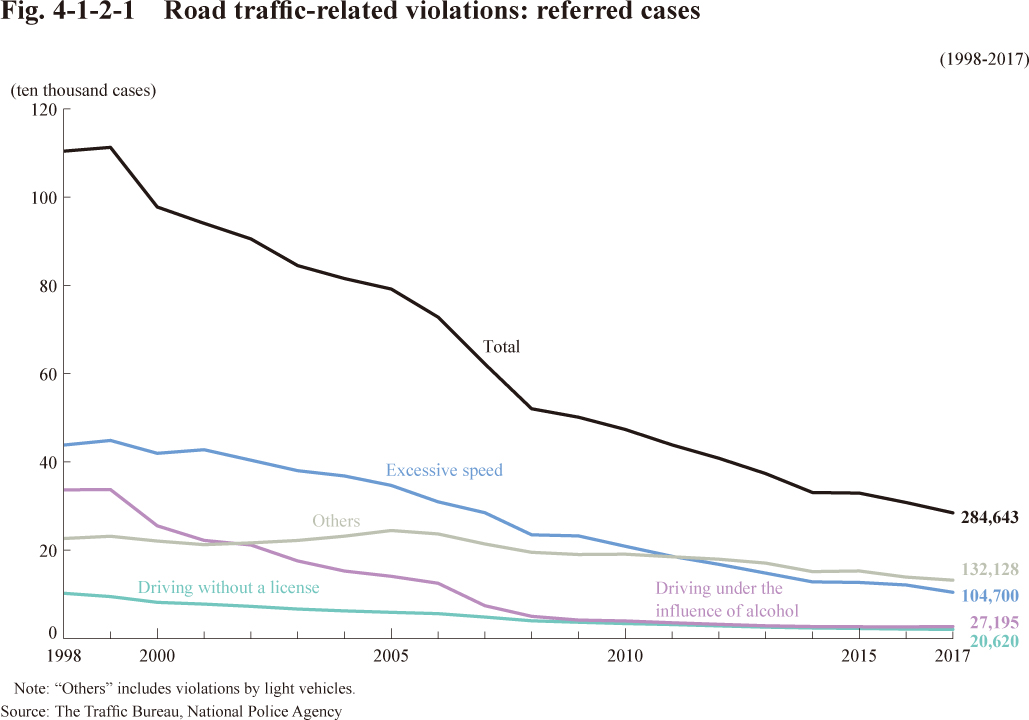 Fig. 4-1-2-1 Road traffic-related violations: referred cases
Chapter 2 Drug Offenses
Section 1 Trends in Offenses
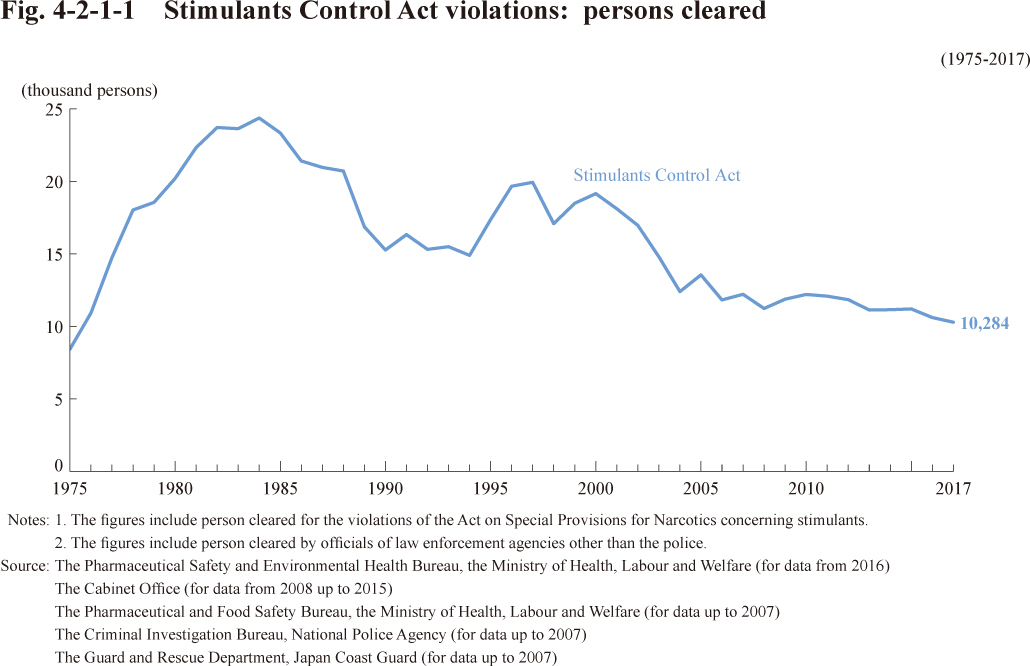 Fig. 4-2-1-1 Stimulants Control Act violations: persons cleared
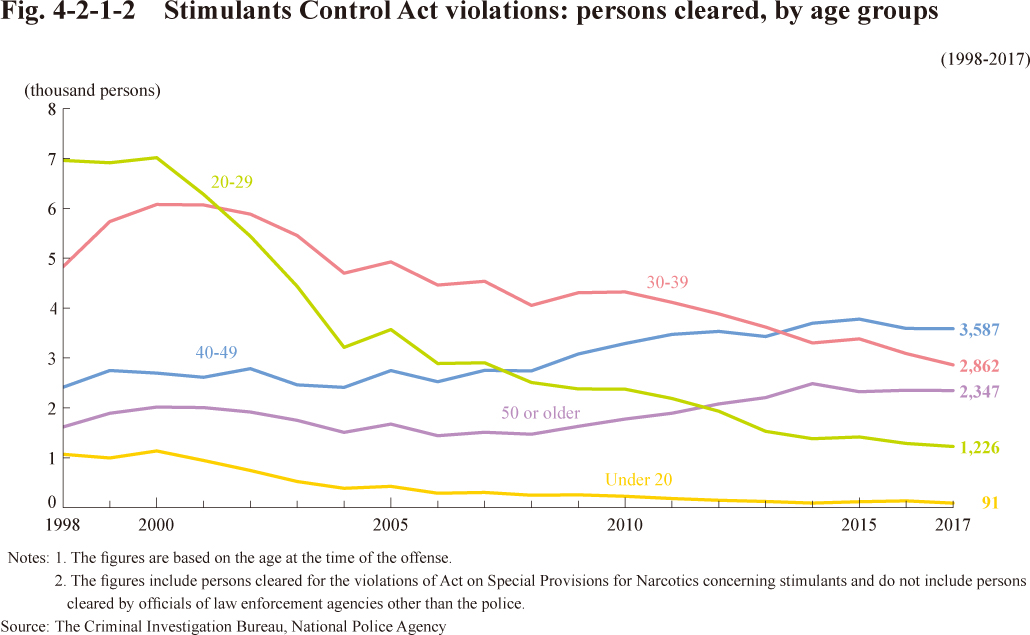 Fig. 4-2-1-2 Stimulants Control Act violations: persons cleared, by age groups
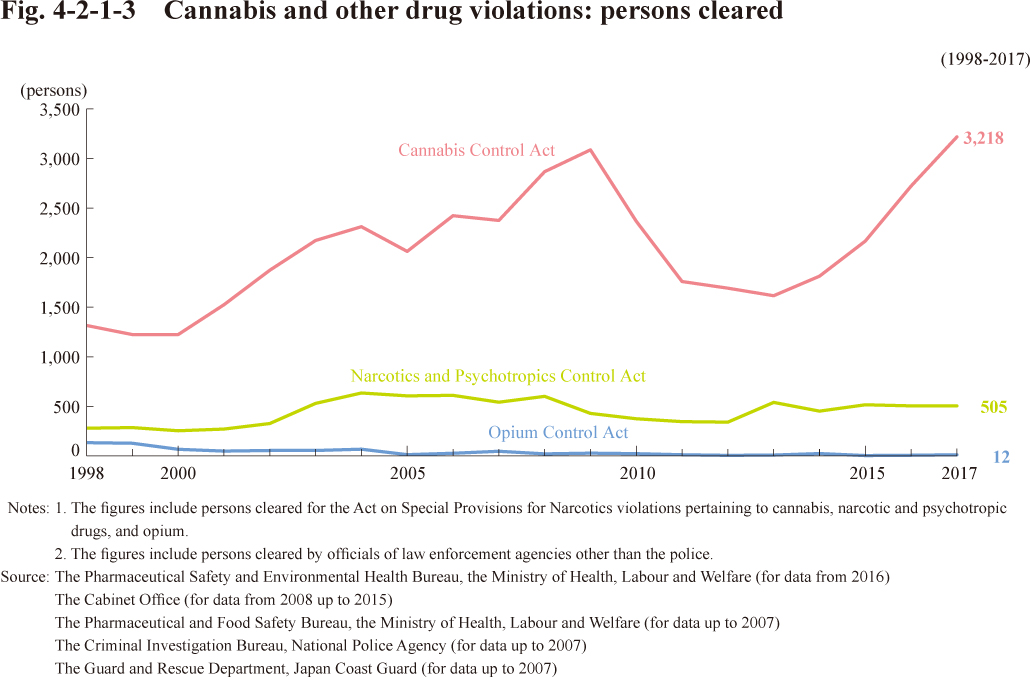 Fig. 4-2-1-3 Cannabis and other drug violations: persons cleared
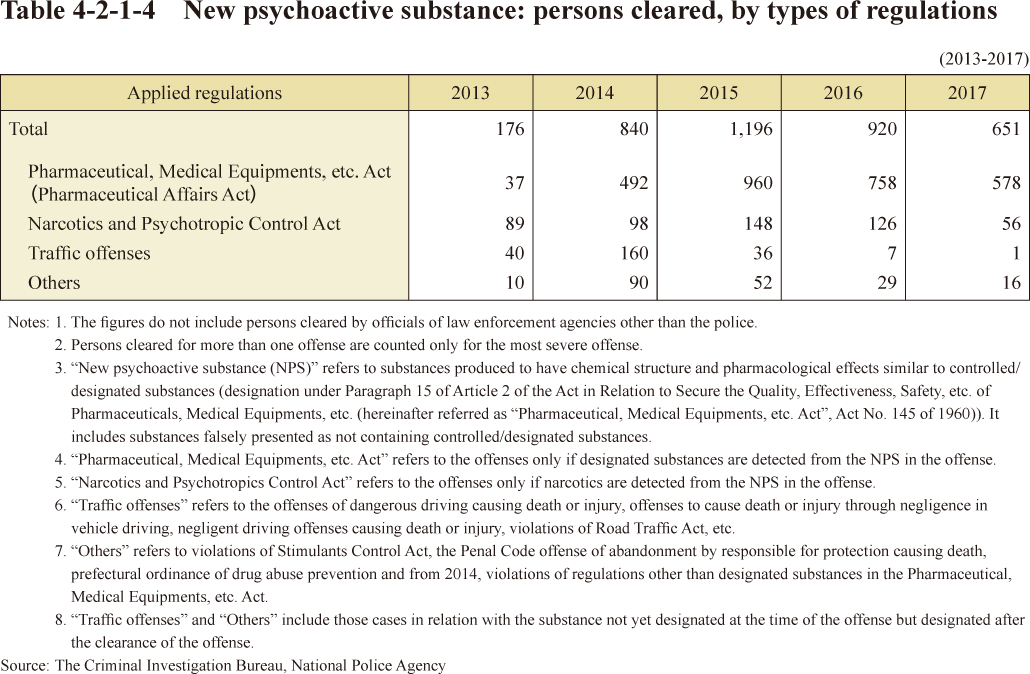 Table 4-2-1-4 New psychoactive substance: persons cleared, by types of regulations
Section 2 Treatment of Drug Offenders
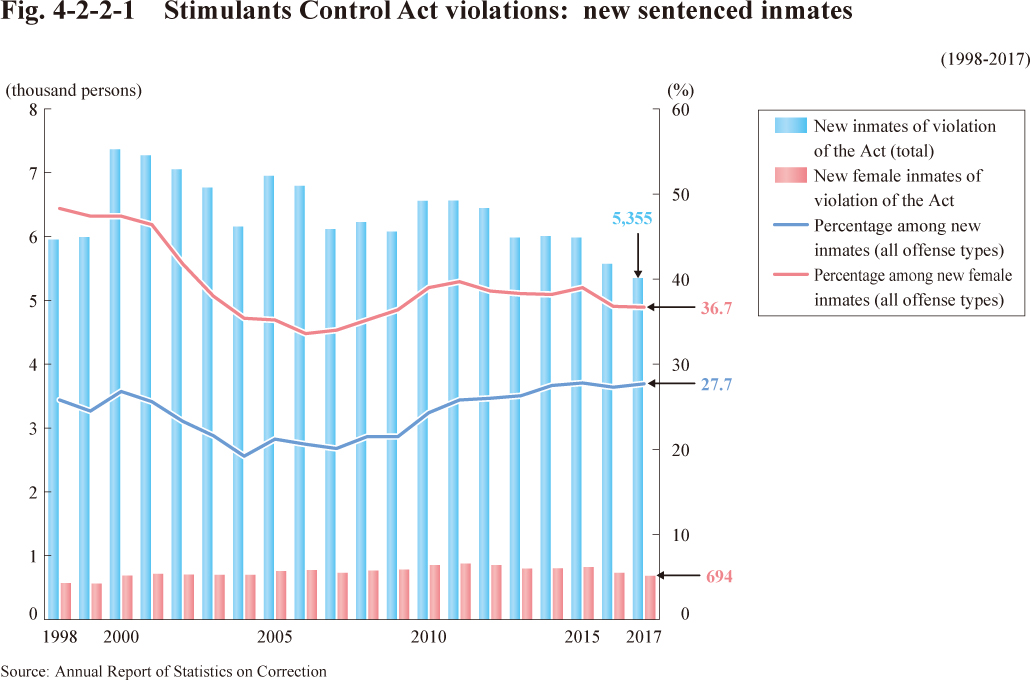 Fig. 4-2-2-1 Stimulants Control Act violations: new sentenced inmates
Chapter 3 Organized Crime
Section 1 Trends in Organized Crime Groups
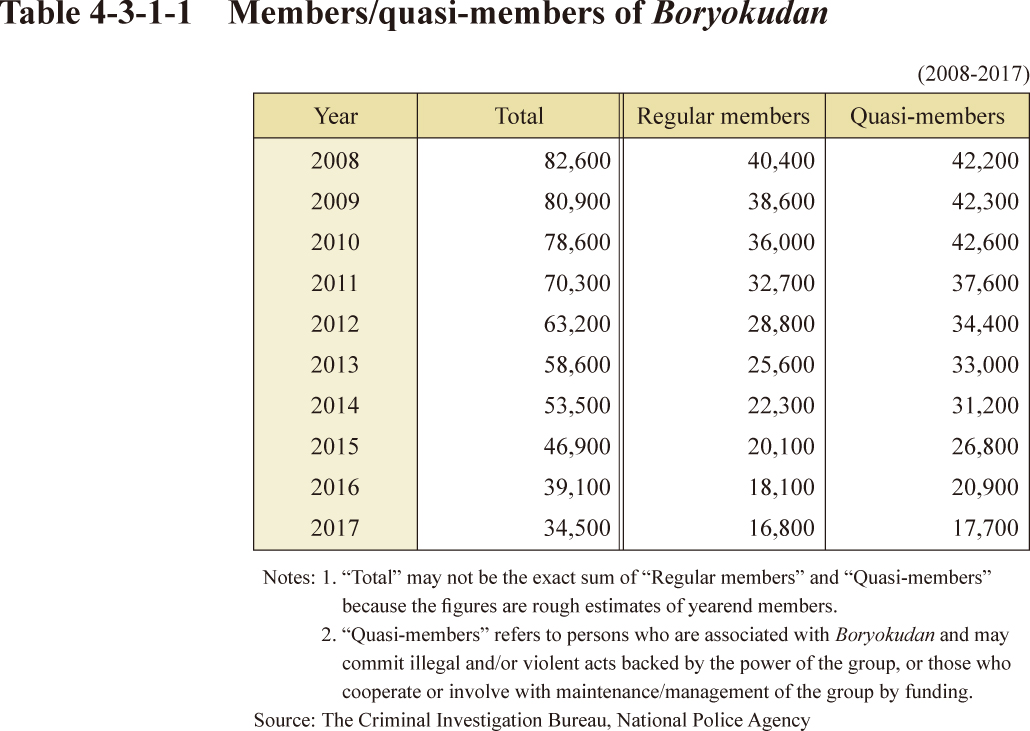 Table 4-3-1-1 Members/quasi-members of Boryokudan
Section 2 Trends in Offenses
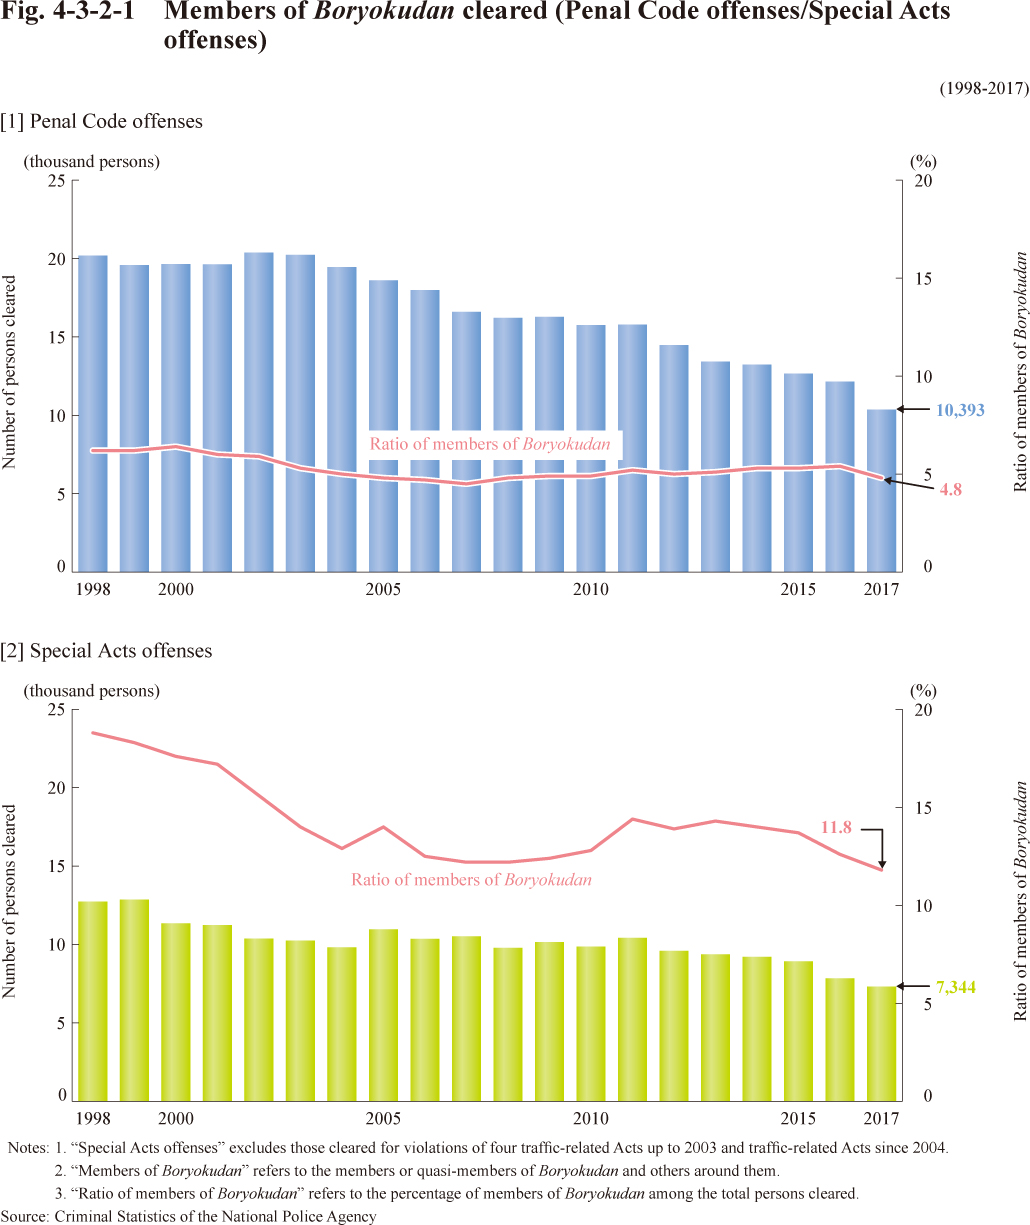 Fig. 4-3-2-1 Members of Boryokudan cleared (Penal Code offenses/Special Acts offenses)
Chapter 4 Financial and Economic Offenses
Section 1 Tax-related Offenses
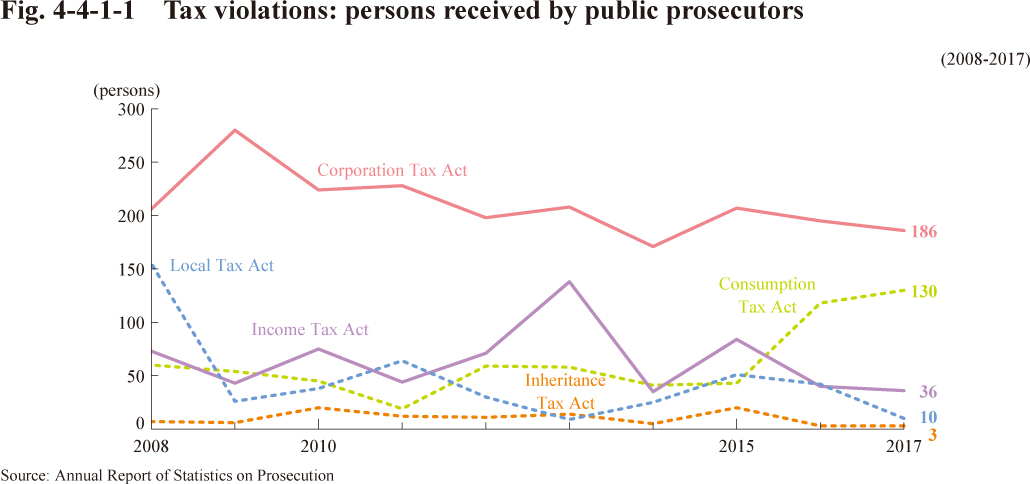 Fig. 4-4-1-1 Tax violations: persons received by public prosecutors
Section 2 Economic Offenses
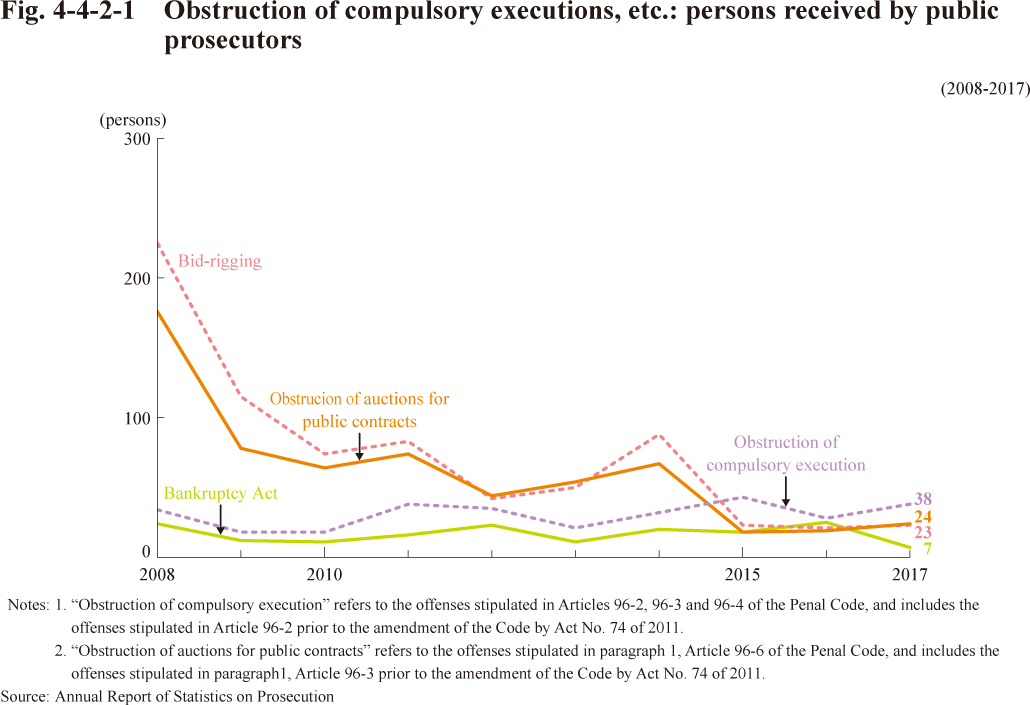 Fig. 4-4-2-1 Obstruction of compulsory executions, etc.: persons received by public prosecutors
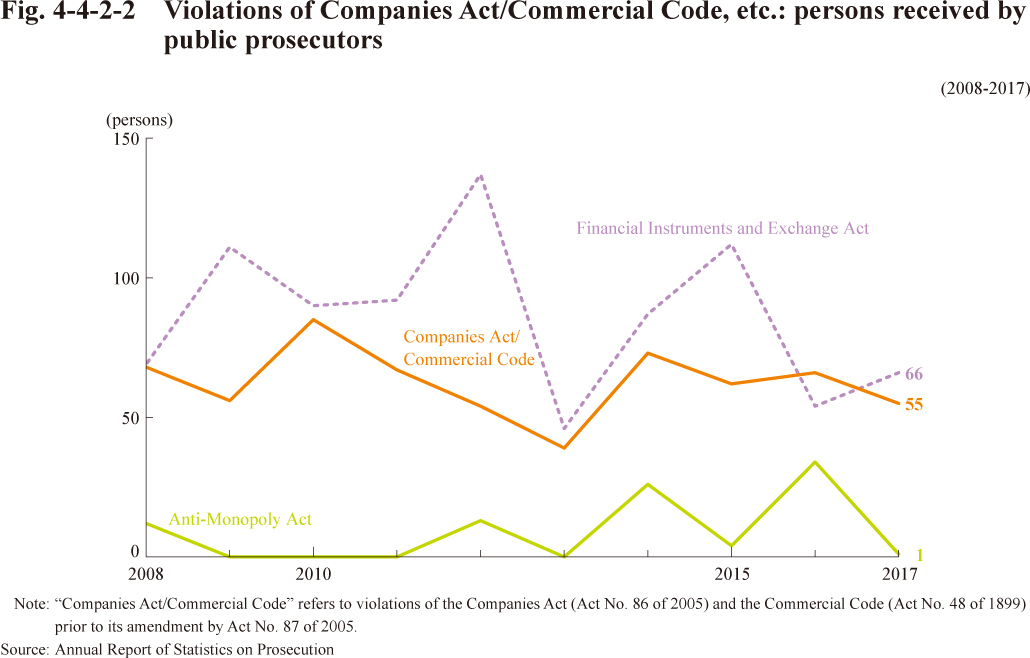
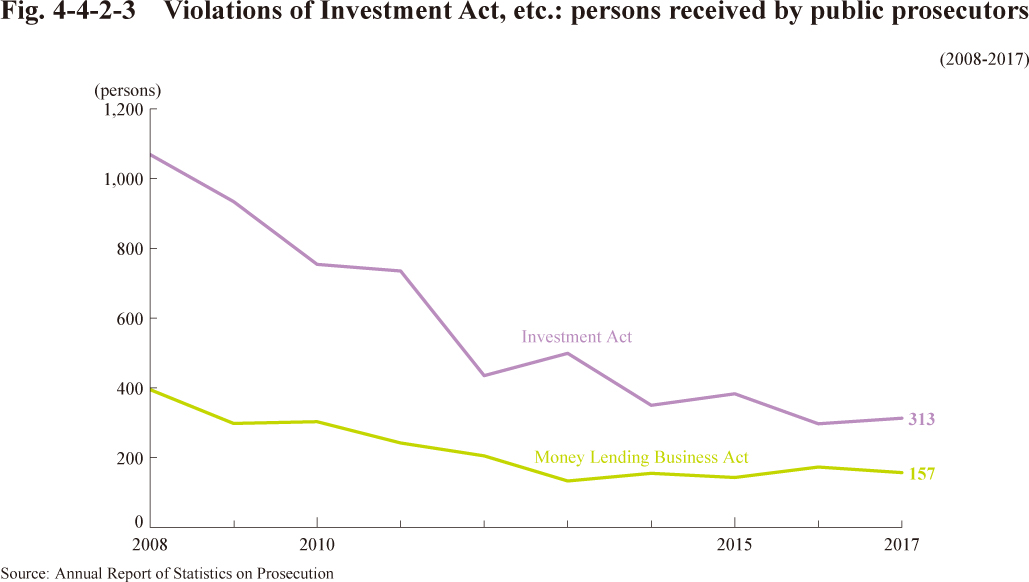 Fig. 4-4-2-3 Violations of Investment Act, etc.: persons received by public prosecutors
Section 3 Intellectual Property-related Offenses
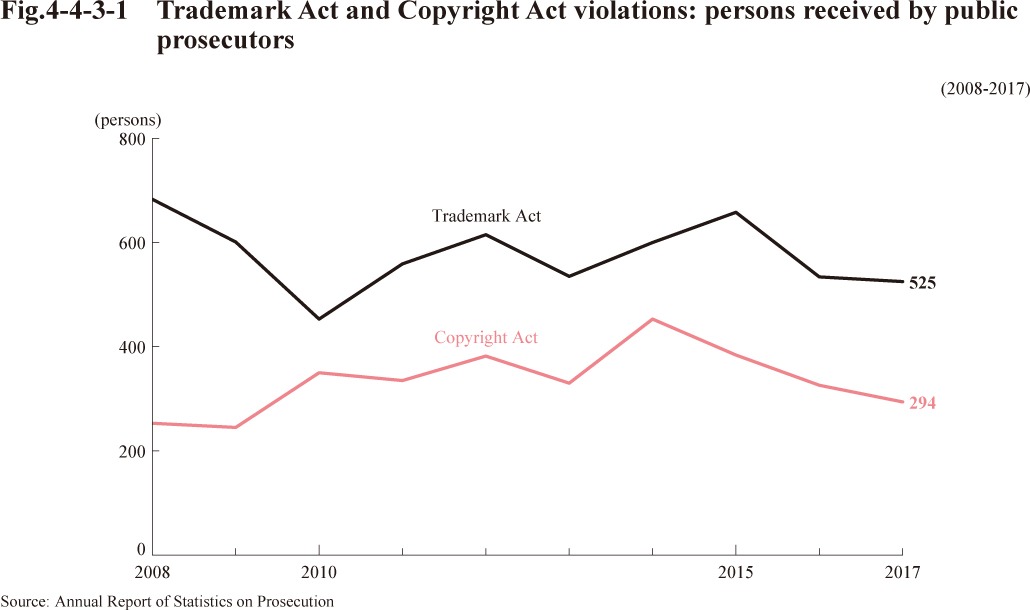 Fig. 4-4-3-1 Trademark Act and Copyright Act violations: persons received by public prosecutors
Chapter 5 Cybercrime
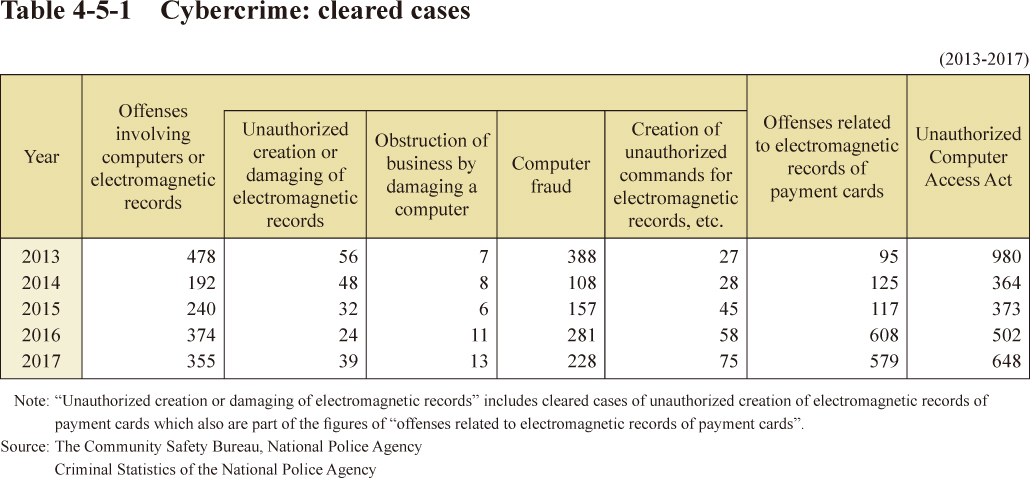 Table 4-5-1 Cybercrime: cleared cases
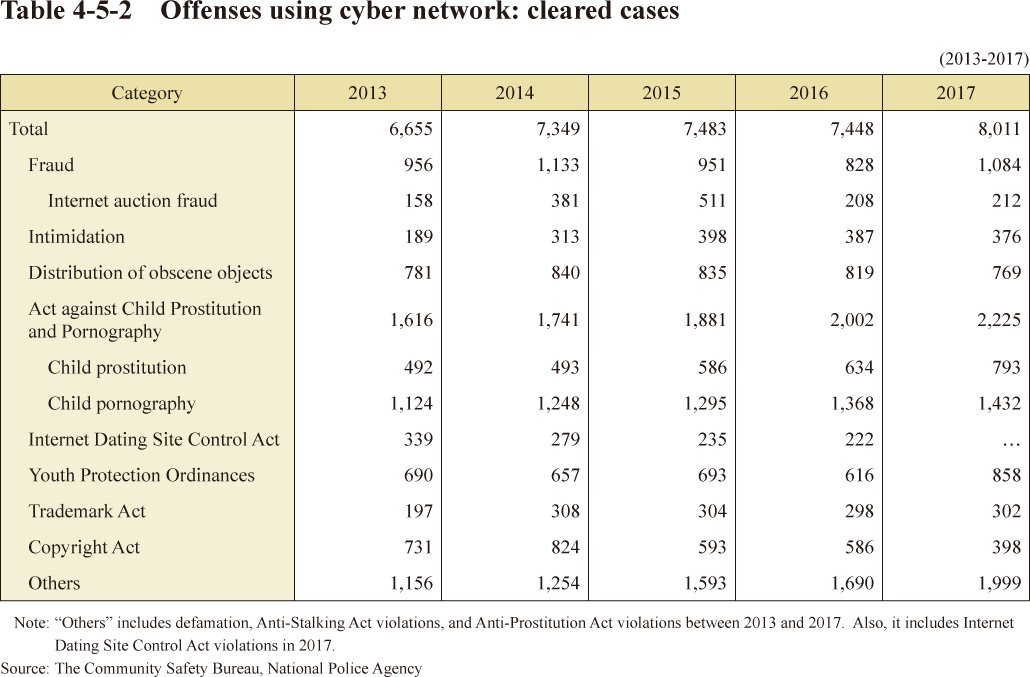 Table 4-5-2 Offenses using cyber network: cleared cases
Chapter 6 Child Abuse, Spousal Offenses and Stalking-related Crimes
Section 1 Child Abuse
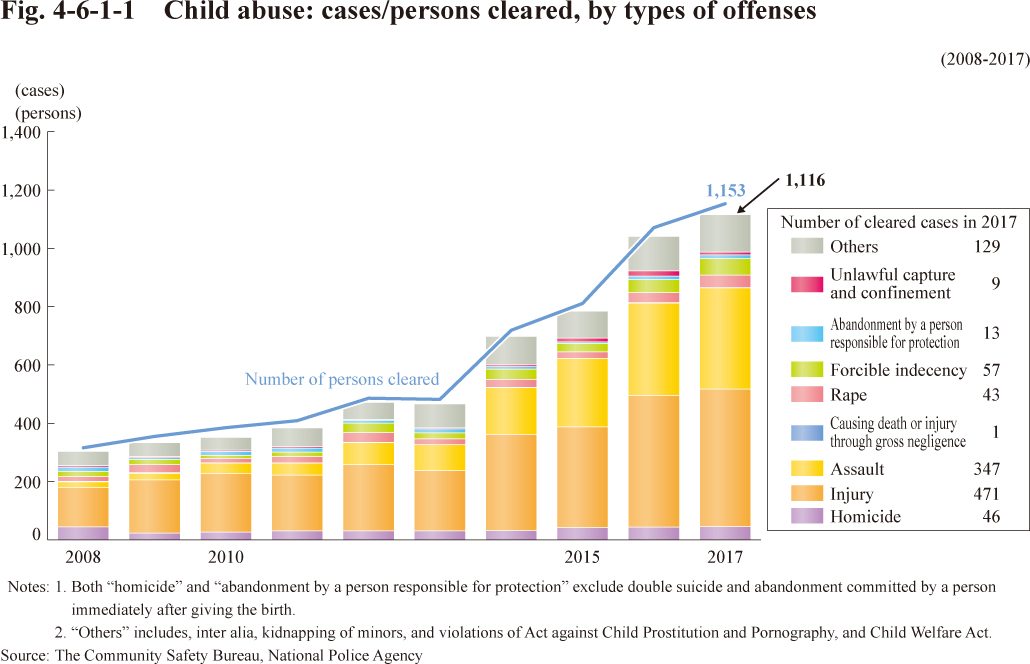 Fig. 4-6-1-1 Child abuse: cases/persons cleared, by types of offenses
Section 2 Spousal Offenses
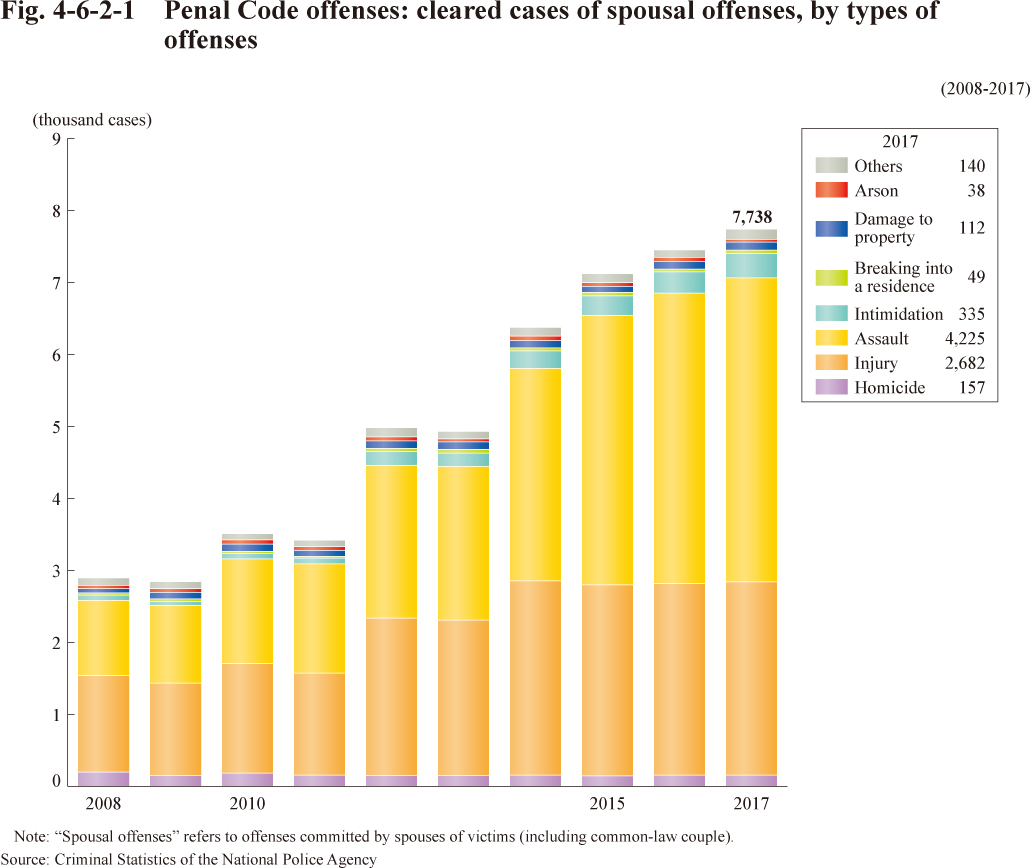 Fig. 4-6-2-1 Penal Code offenses: cleared cases of spousal offenses, by types of offenses
Section 3 Stalking-related Crimes
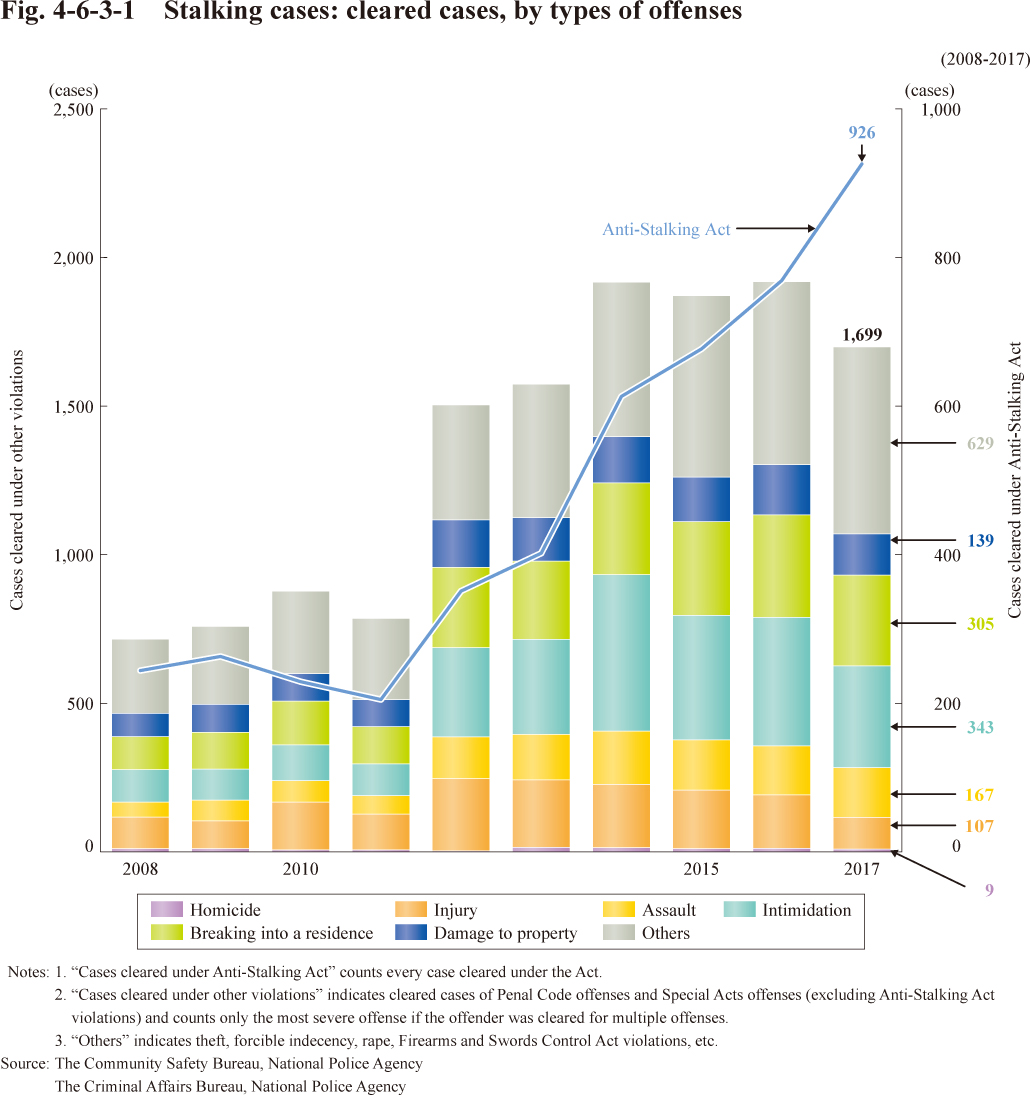 Fig. 4-6-3-1 Stalking cases: cleared cases, by types of offenses
Chapter 7 Offenses by Women
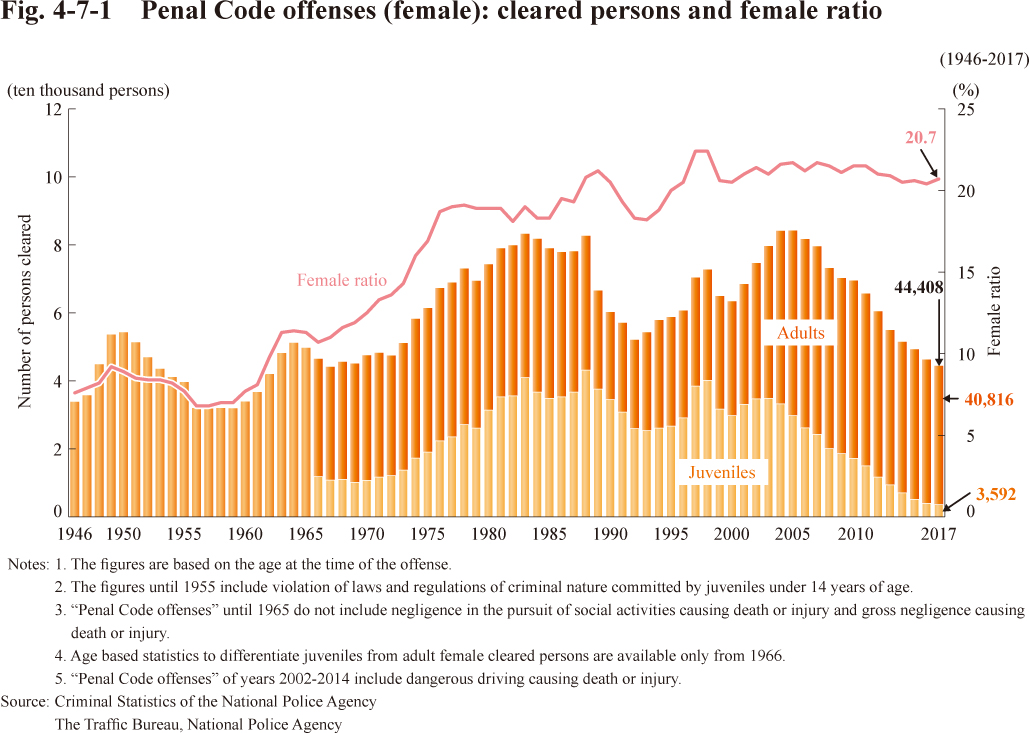 Fig. 4-7-1 Penal Code offenses (female): cleared persons and female ratio
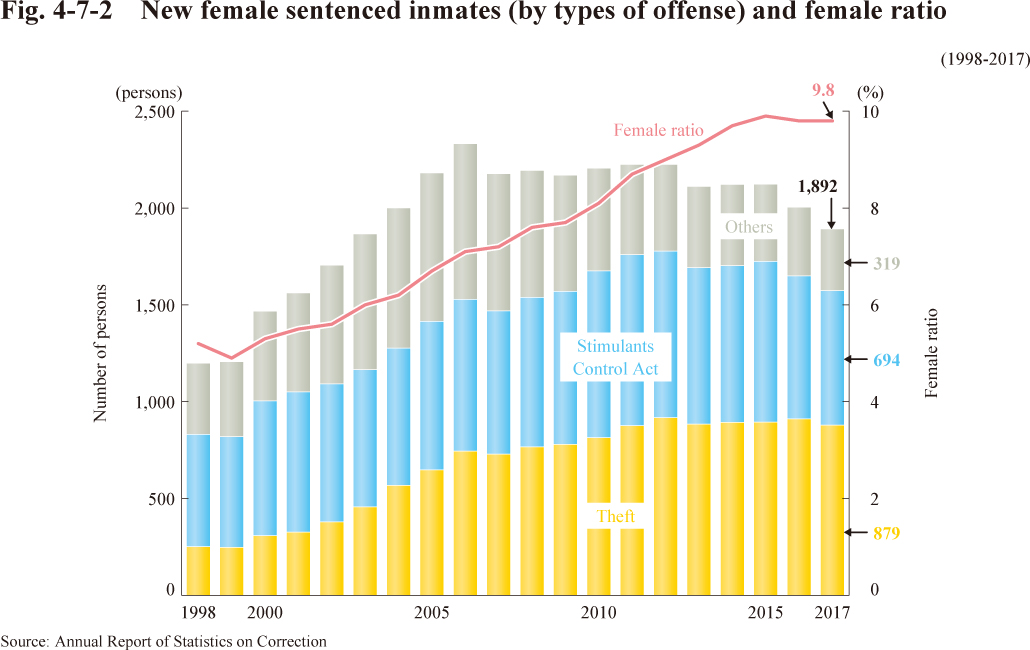 Fig. 4-7-2 New female sentenced inmates (by types of offense) and female ratio
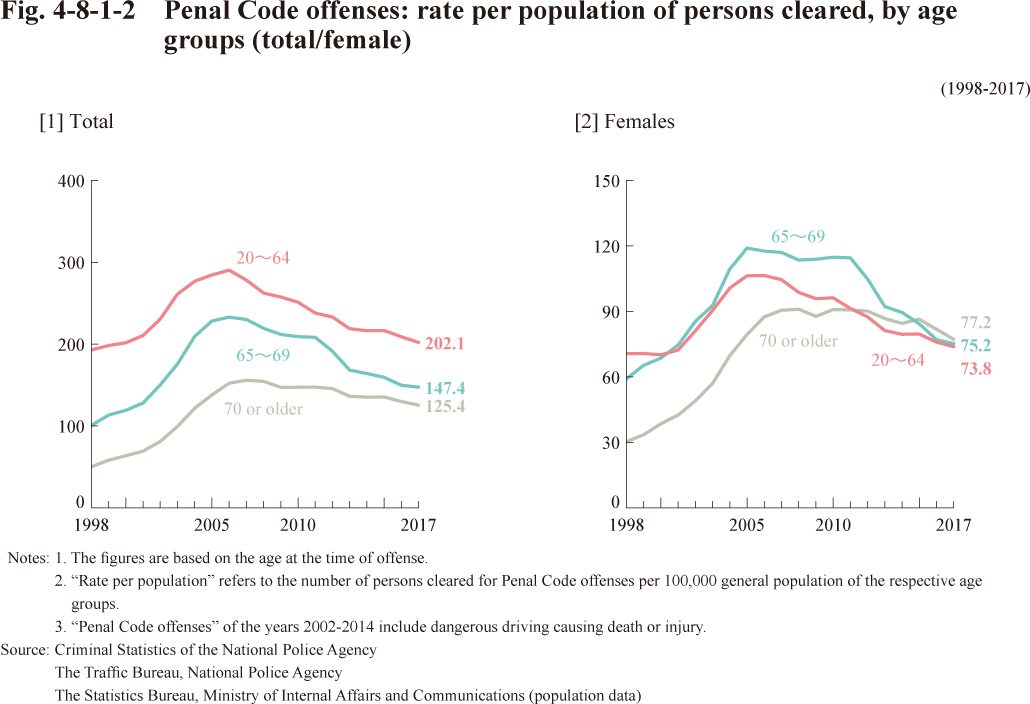
Chapter 8 Offenses by the Elderly
Section 1 Trends in Offenses
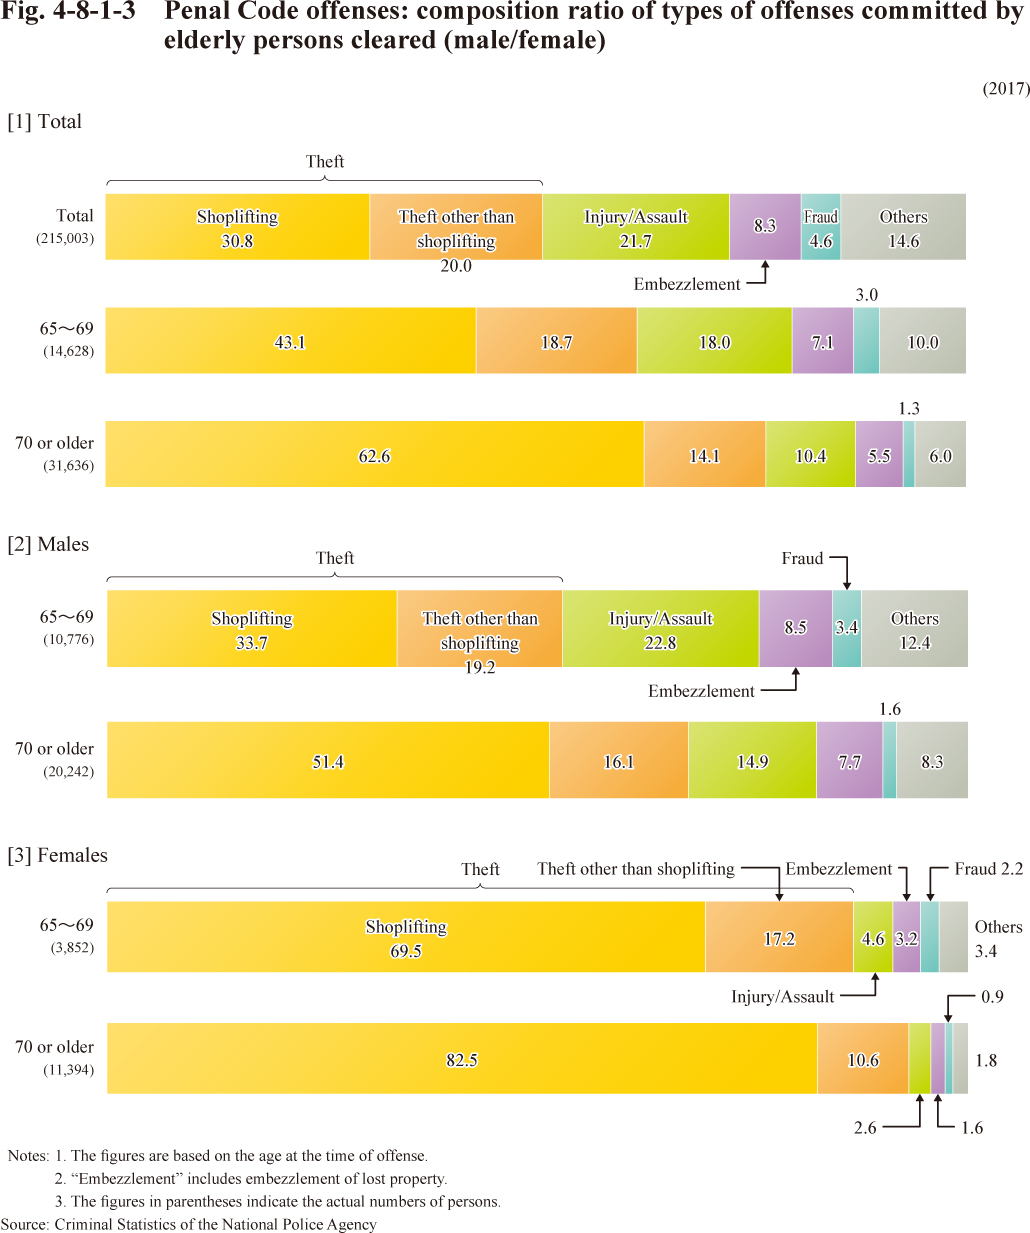
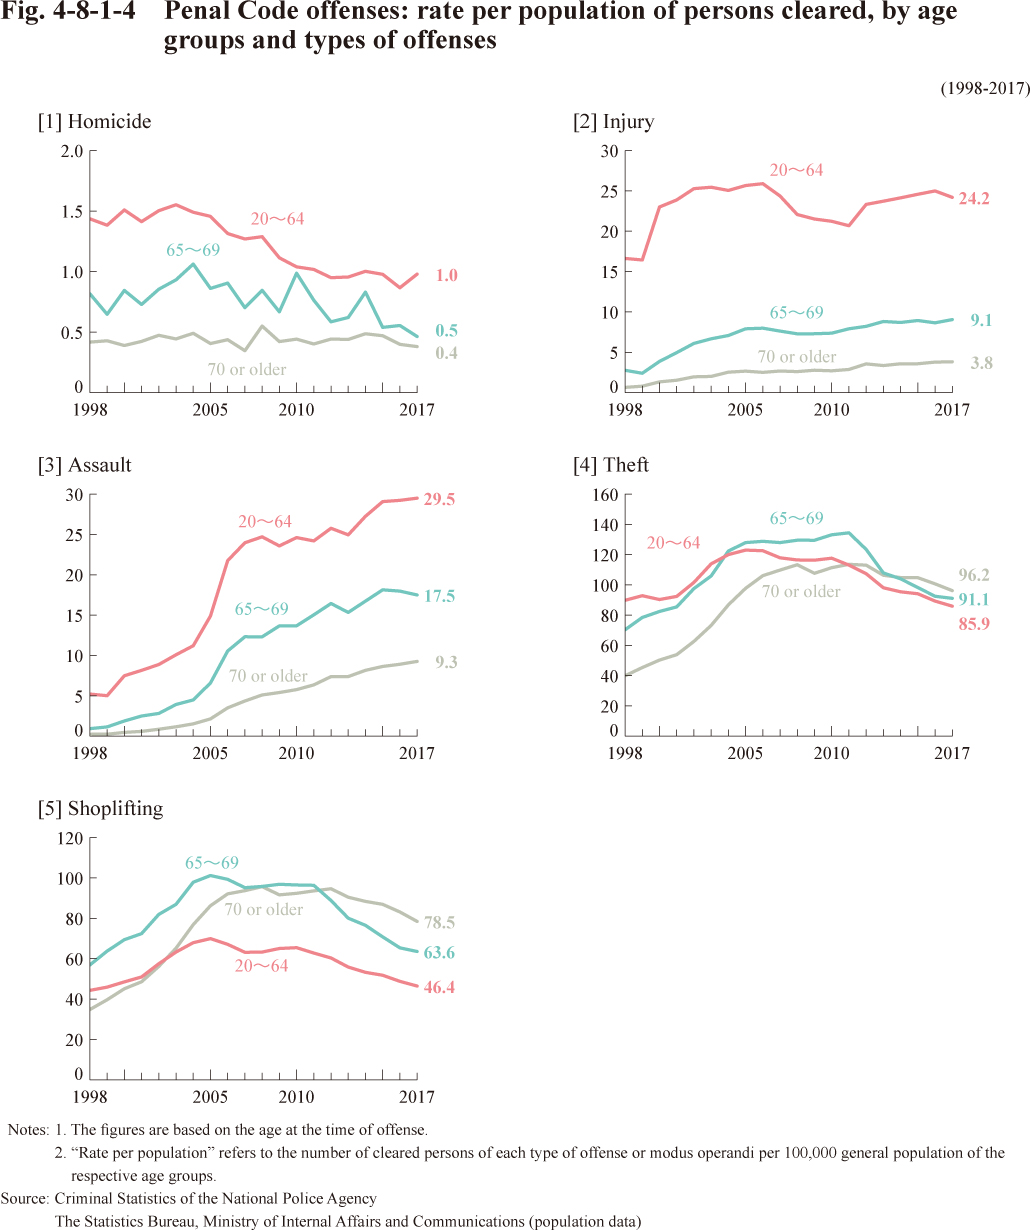
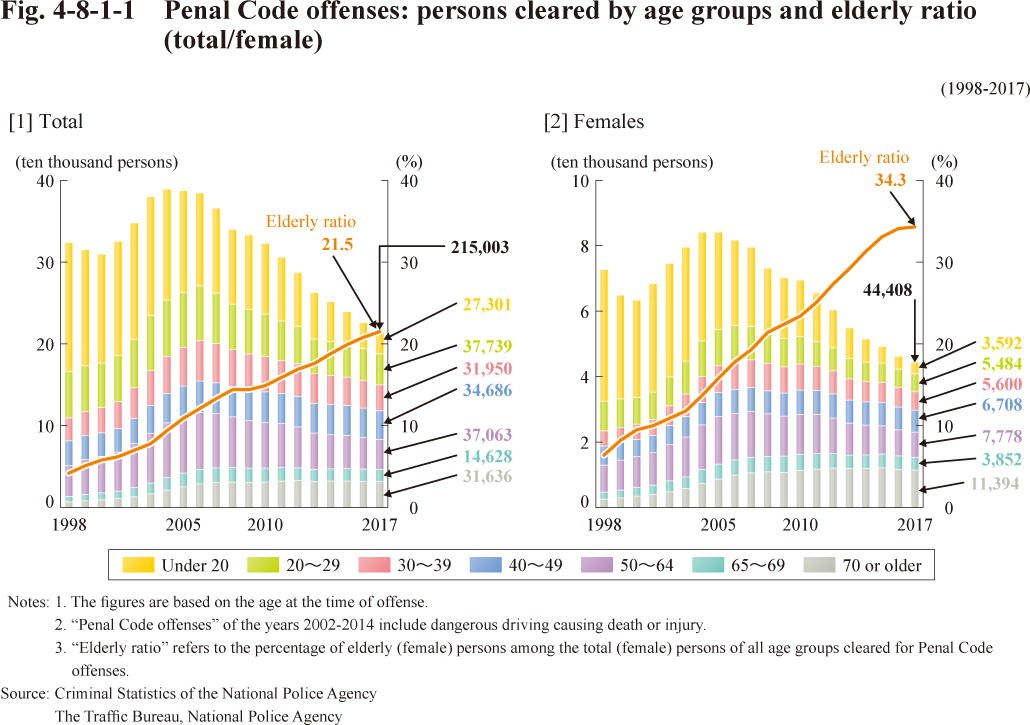 Fig. 4-8-1-1 Penal Code offenses: persons cleared by age groups and elderly ratio (total/female)
Section 2 Imprisonment of Elderly Offenders
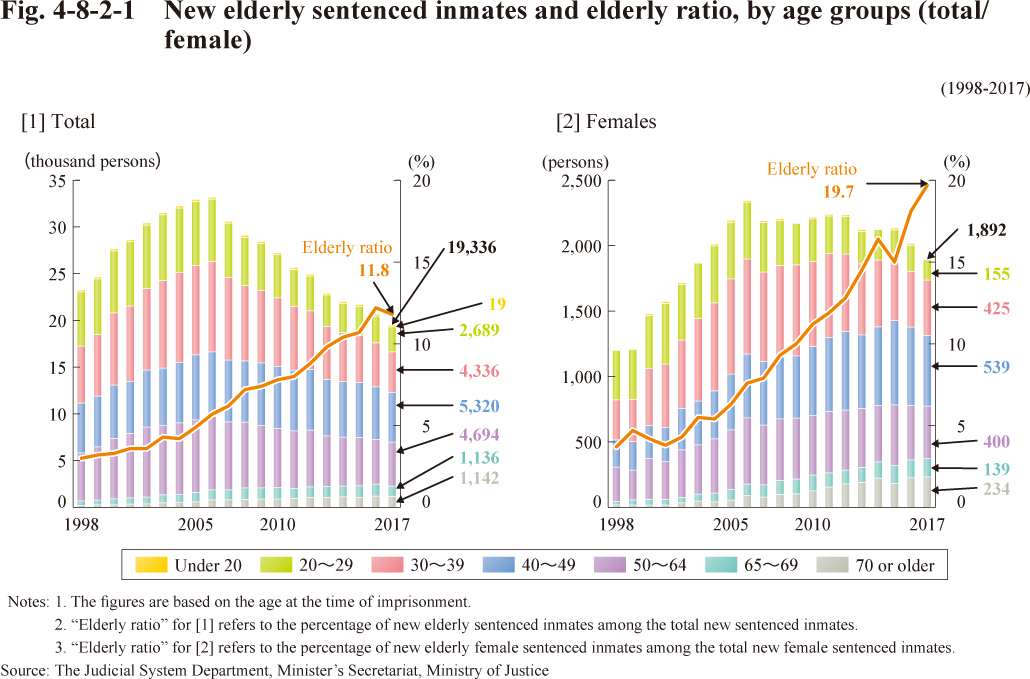 Fig. 4-8-2-1 New elderly sentenced inmates and elderly ratio, by age groups (total/female)
Chapter 9 Offenses by Foreign Nationals
Section 1 Trends in Offenses
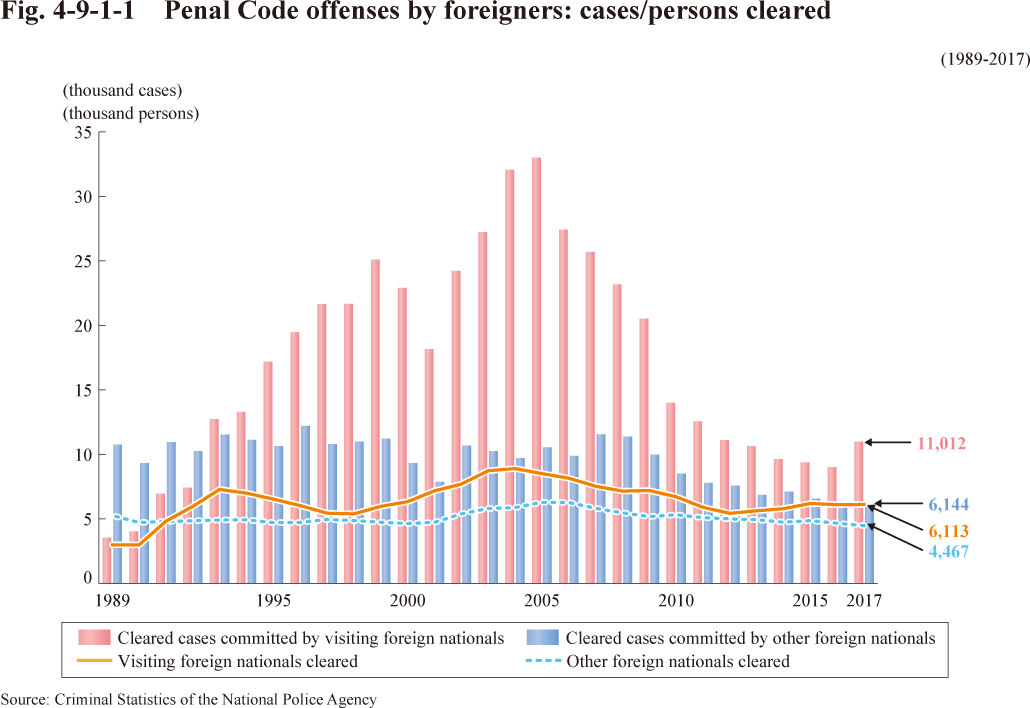 Fig. 4-9-1-1 Penal Code offenses by foreigners: cases/persons cleared
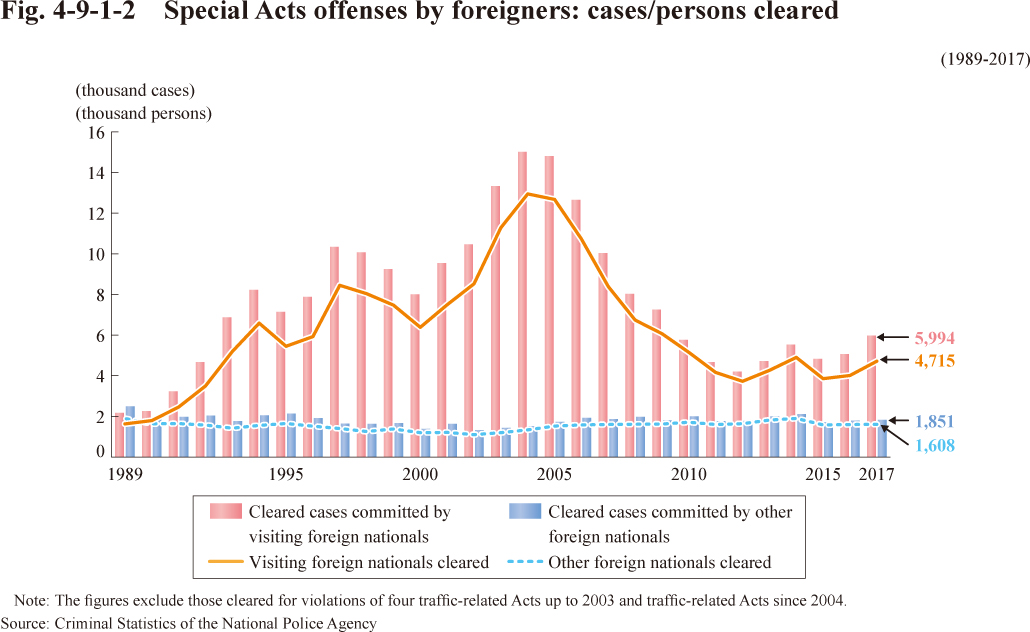 Fig. 4-9-1-2 Special Acts offenses by foreigners: cases/persons cleared
Section 2 Treatment
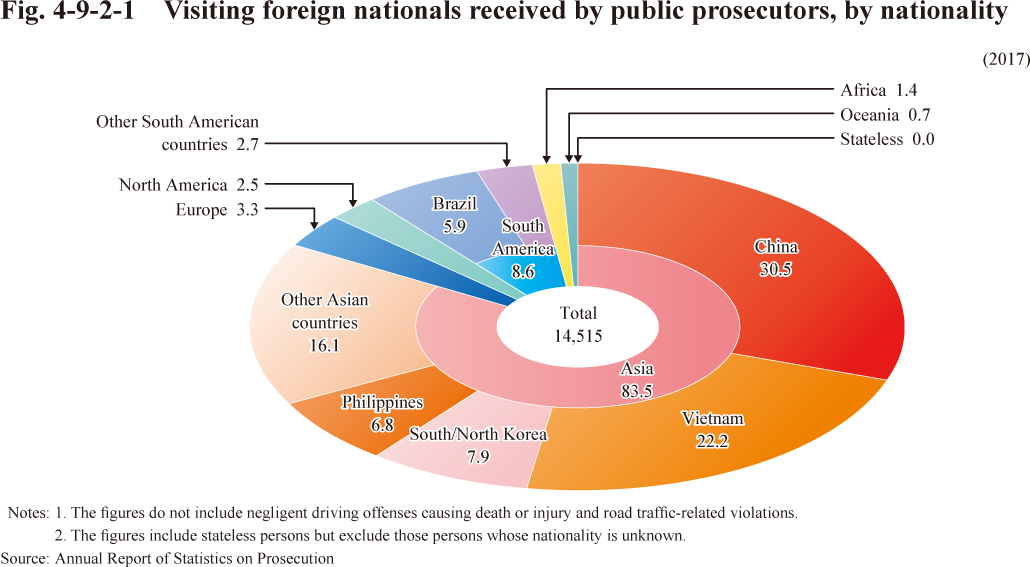 Fig. 4-9-2-1 Visiting foreign nationals received by public prosecutors, by nationality
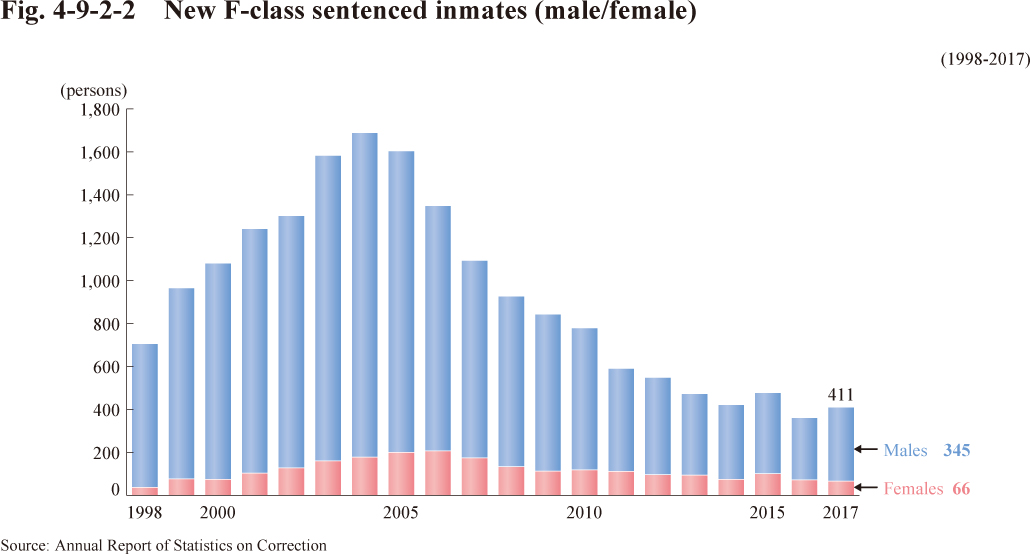 Fig. 4-9-2-2 New F-class sentenced inmates (male/female)
Chapter 10 Offenses by Those with Mental Disorders
Section 1 Trends in Offenses
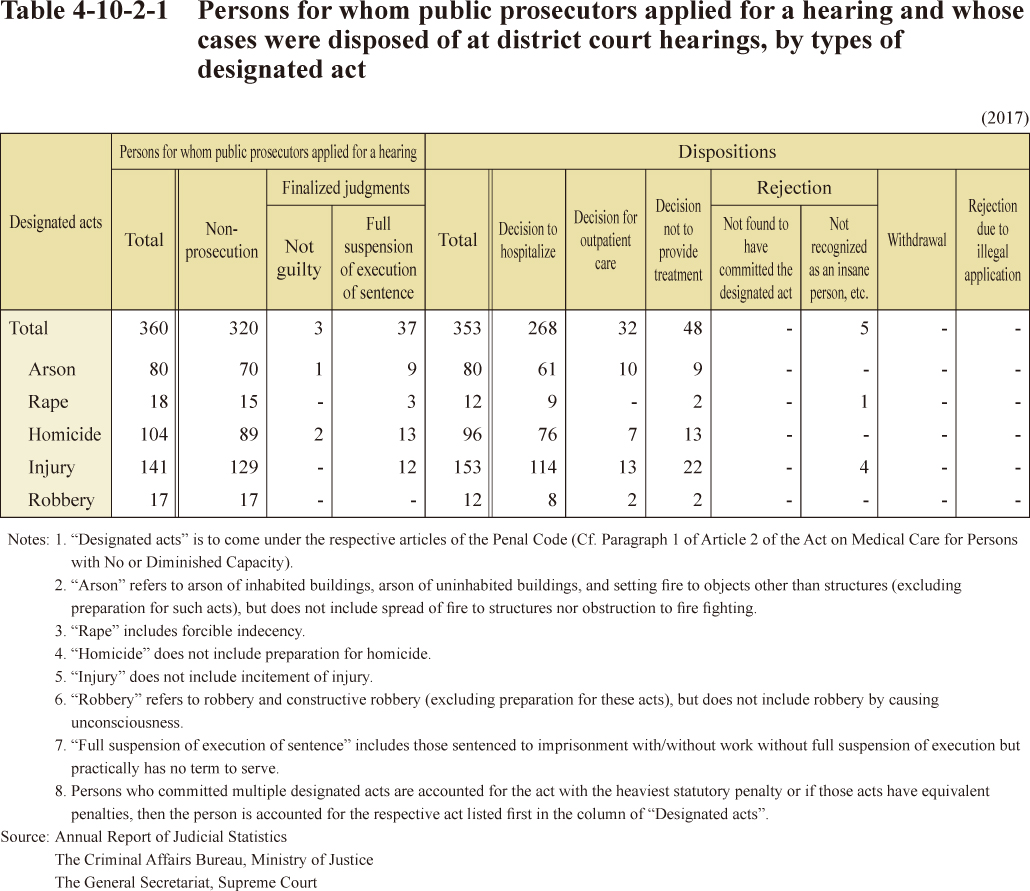
Section 2 Medical Care and Treatment System for Mentally Ill
Chapter 11 Offenses by Public Officials
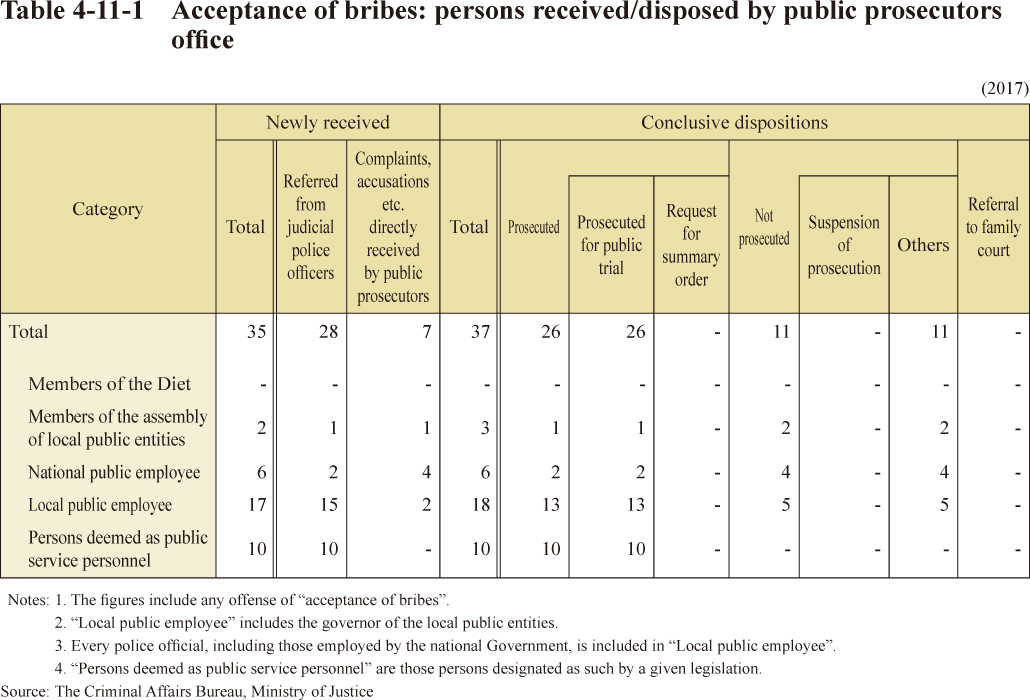 Table 4-11-1 Acceptance of bribes: persons received/disposed by public prosecutors office
PART 5 Repeat Offenders
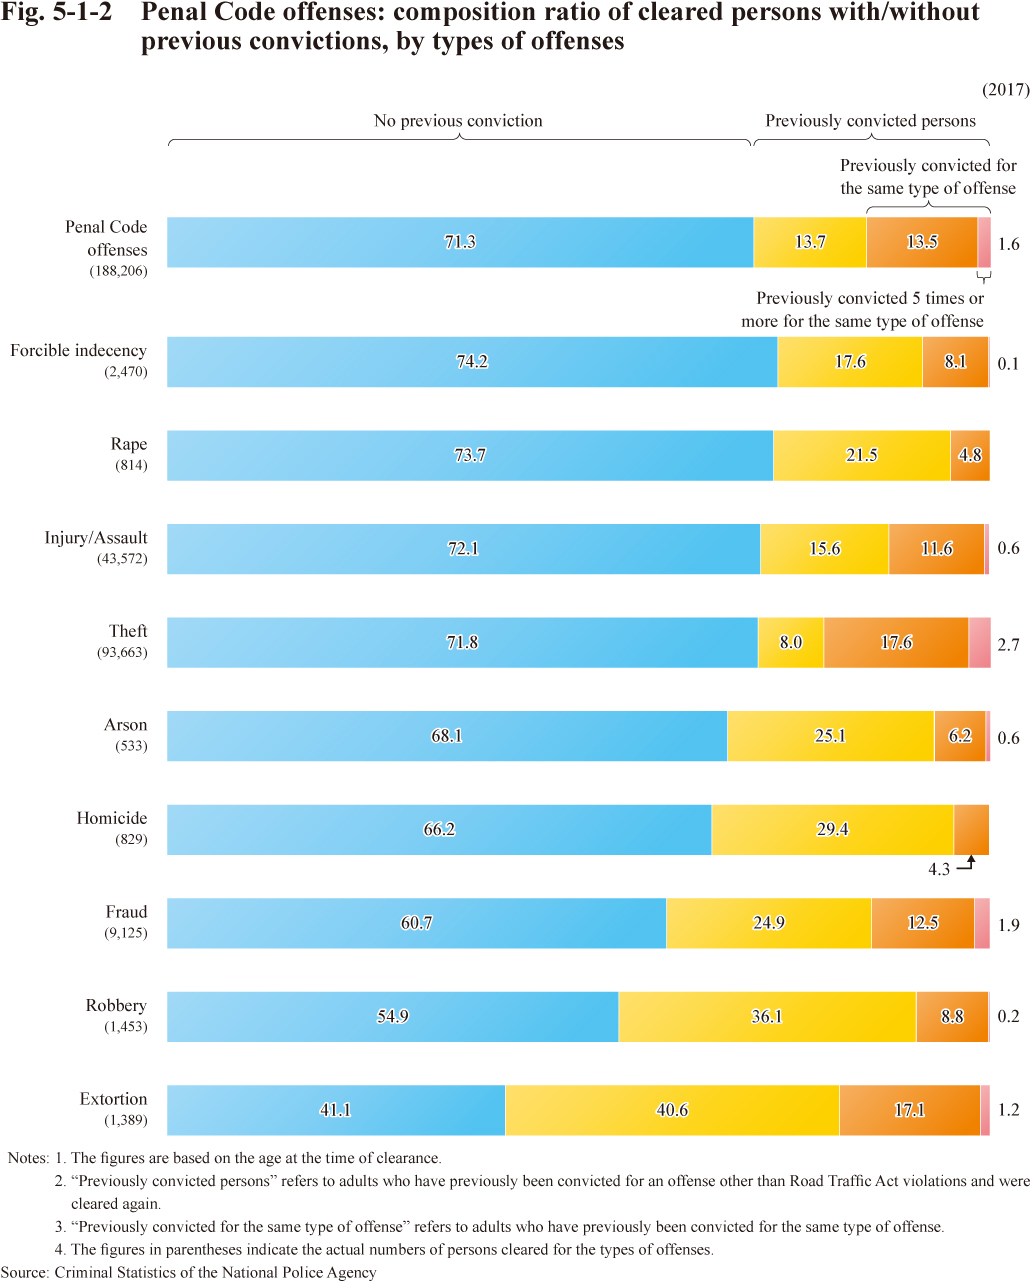
Chapter 1 Cleared Offenders
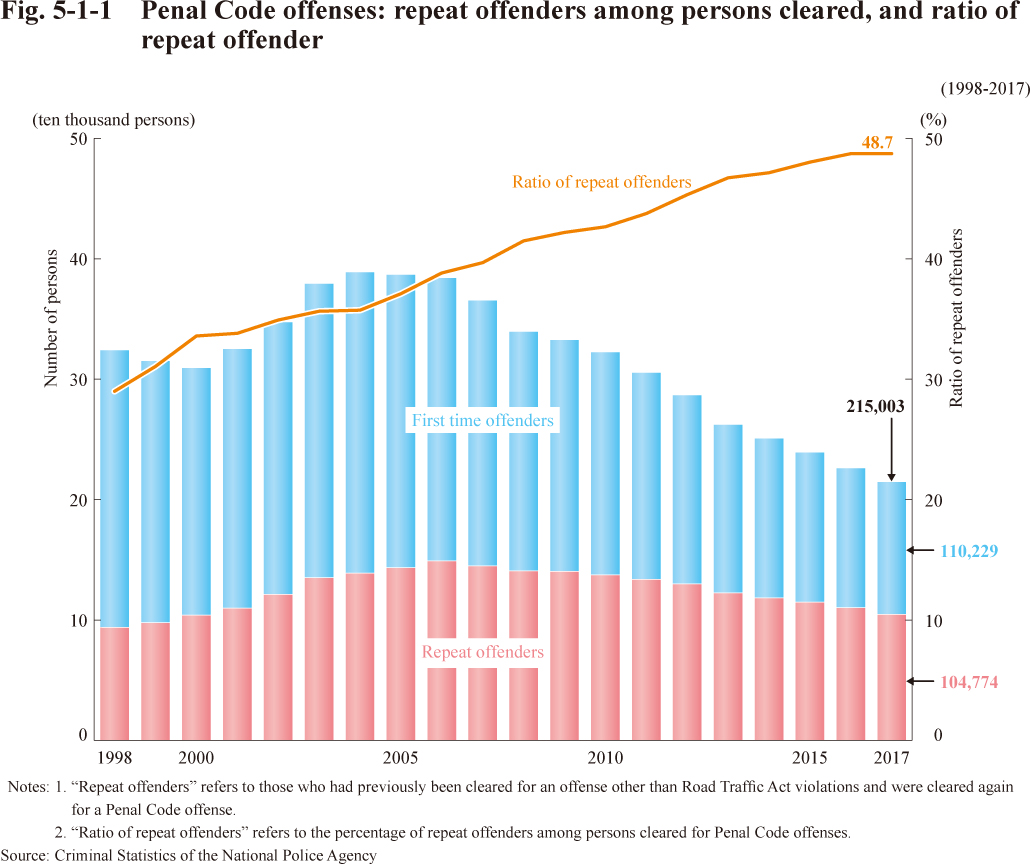 Fig. 5-1-1 Penal Code offenses: repeat offenders among persons cleared, and ratio of repeat offender
Chapter 2 Prosecution
 Table 5-2-1 The number and ratio of ex-convicts among persons prosecuted (by types of offenses)
Chapter 3 Correction
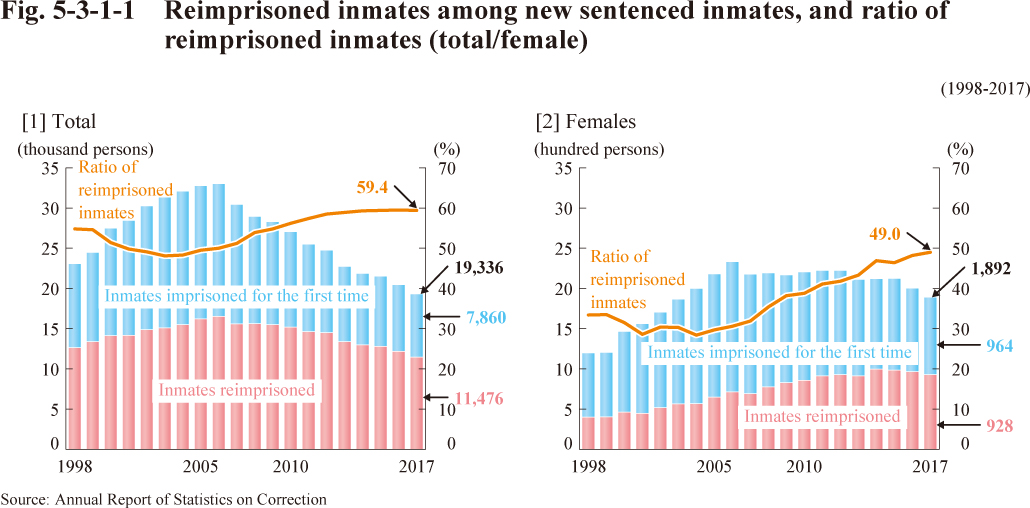
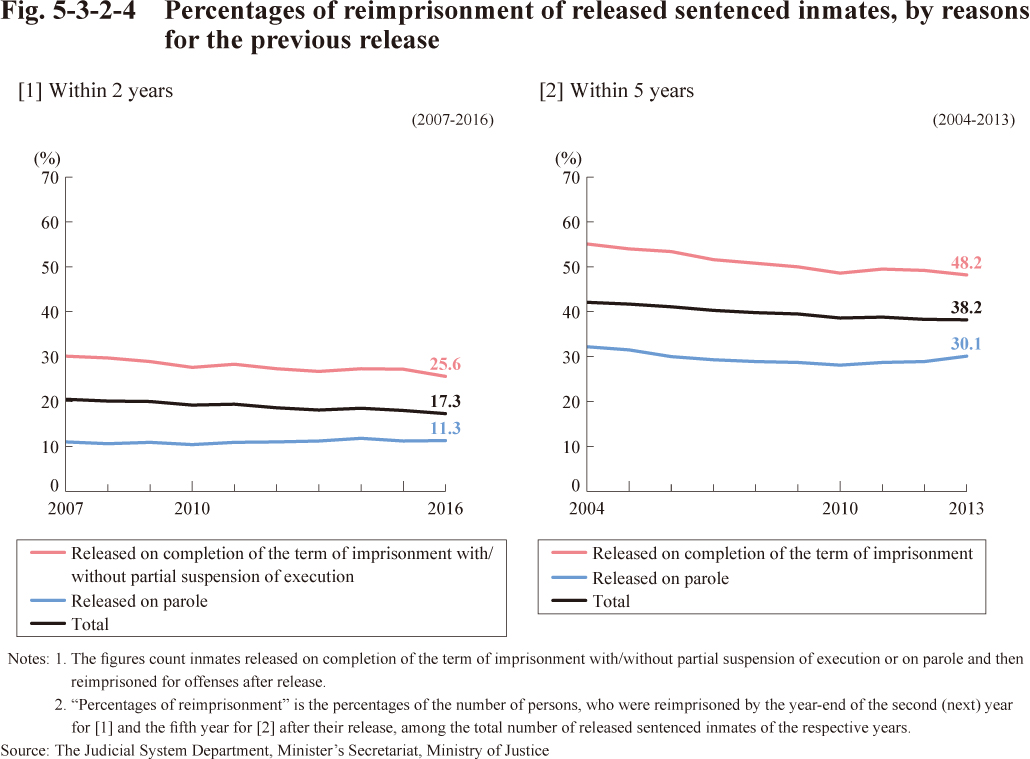
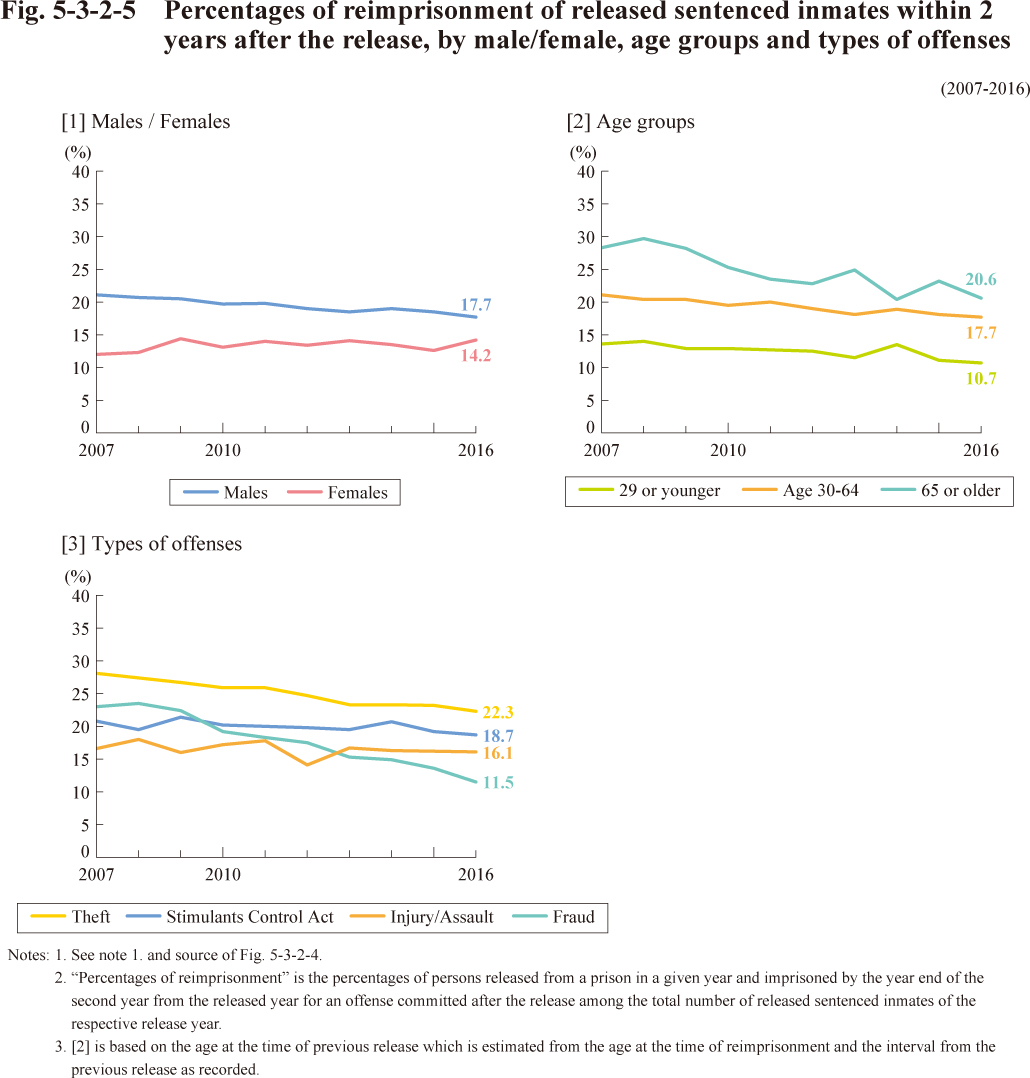
Section 1 Reimprisoned Inmate
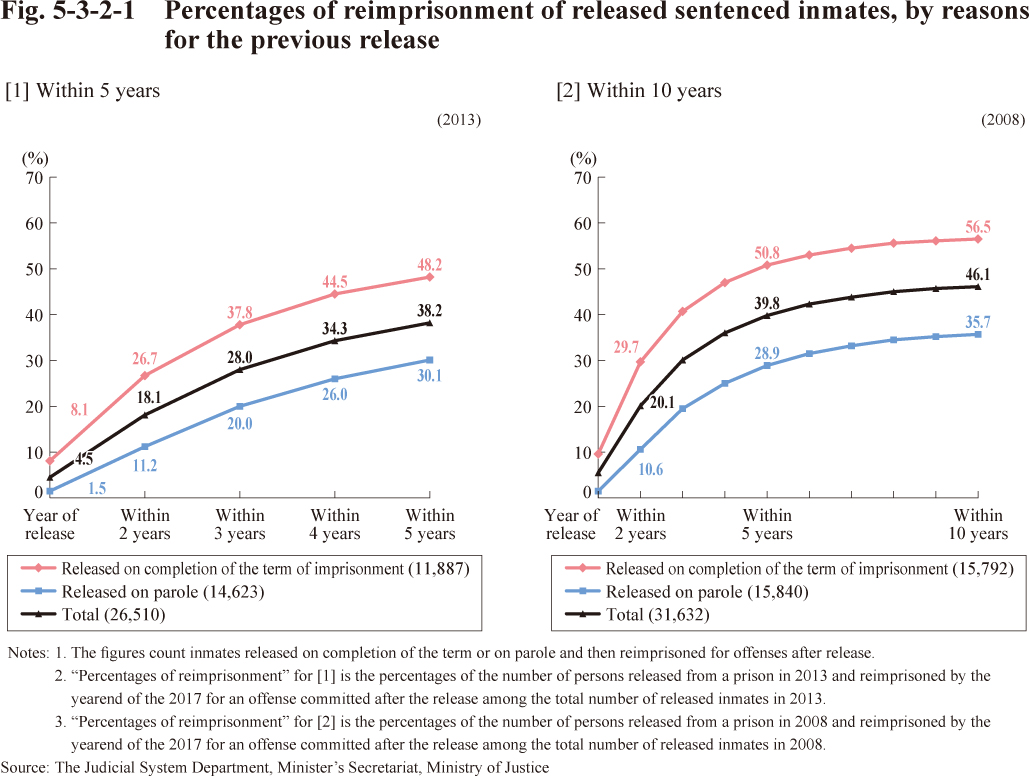
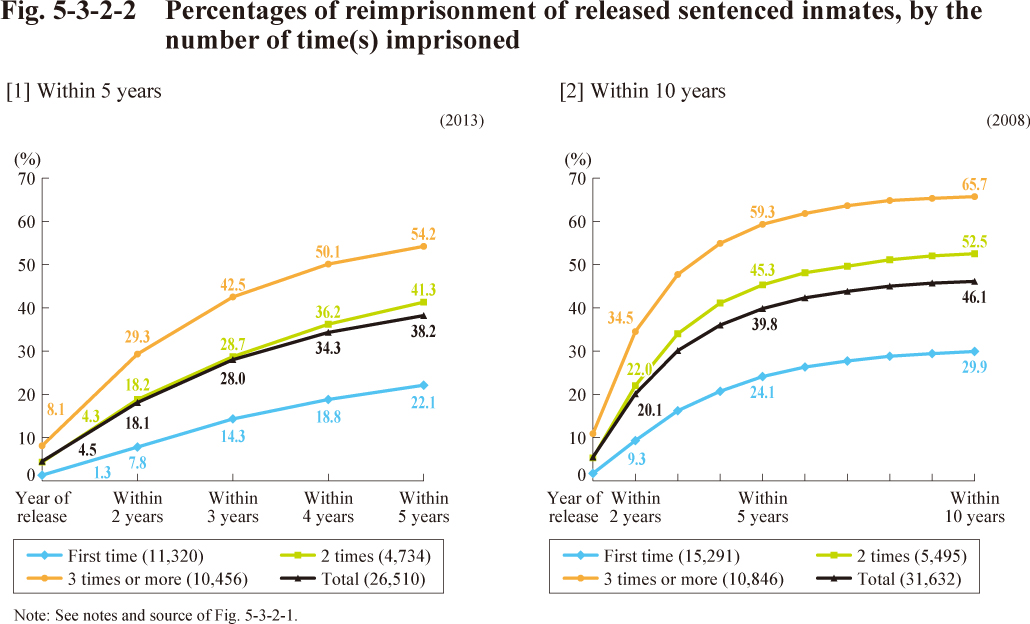
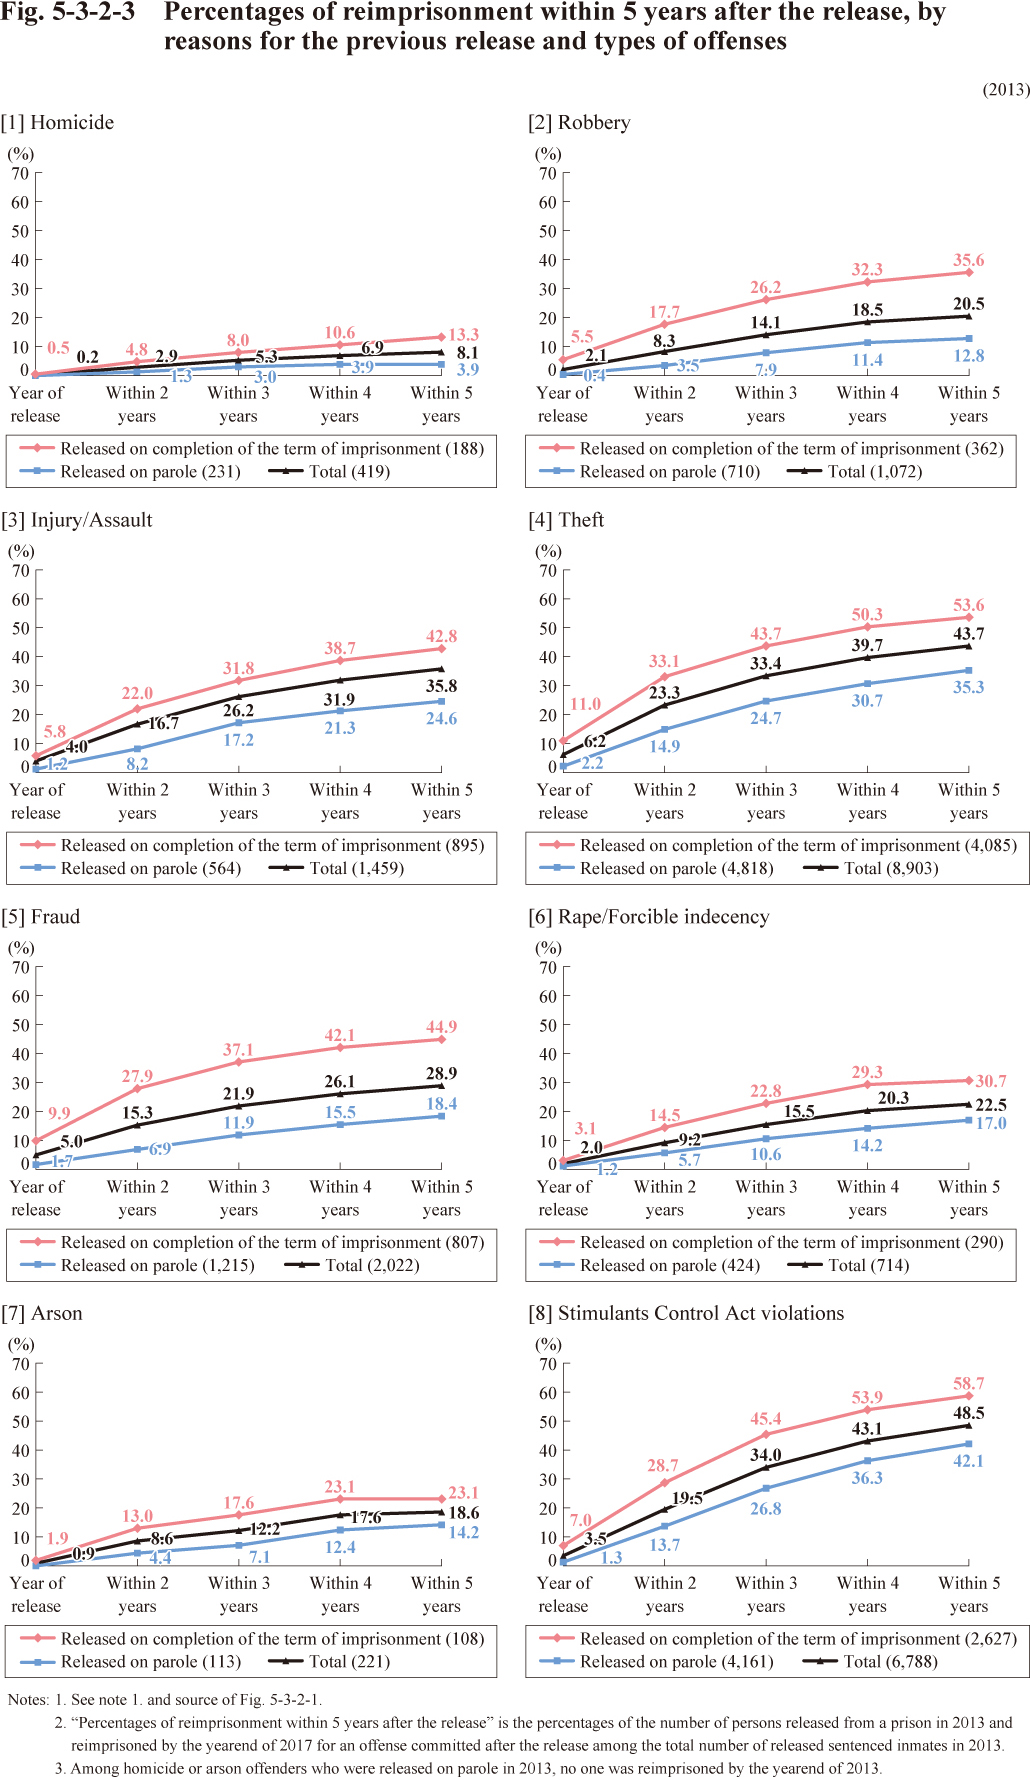
Section 2 Reimprisonment of Released Sentenced Inmates
Chapter 4 Probation/Parole Supervision
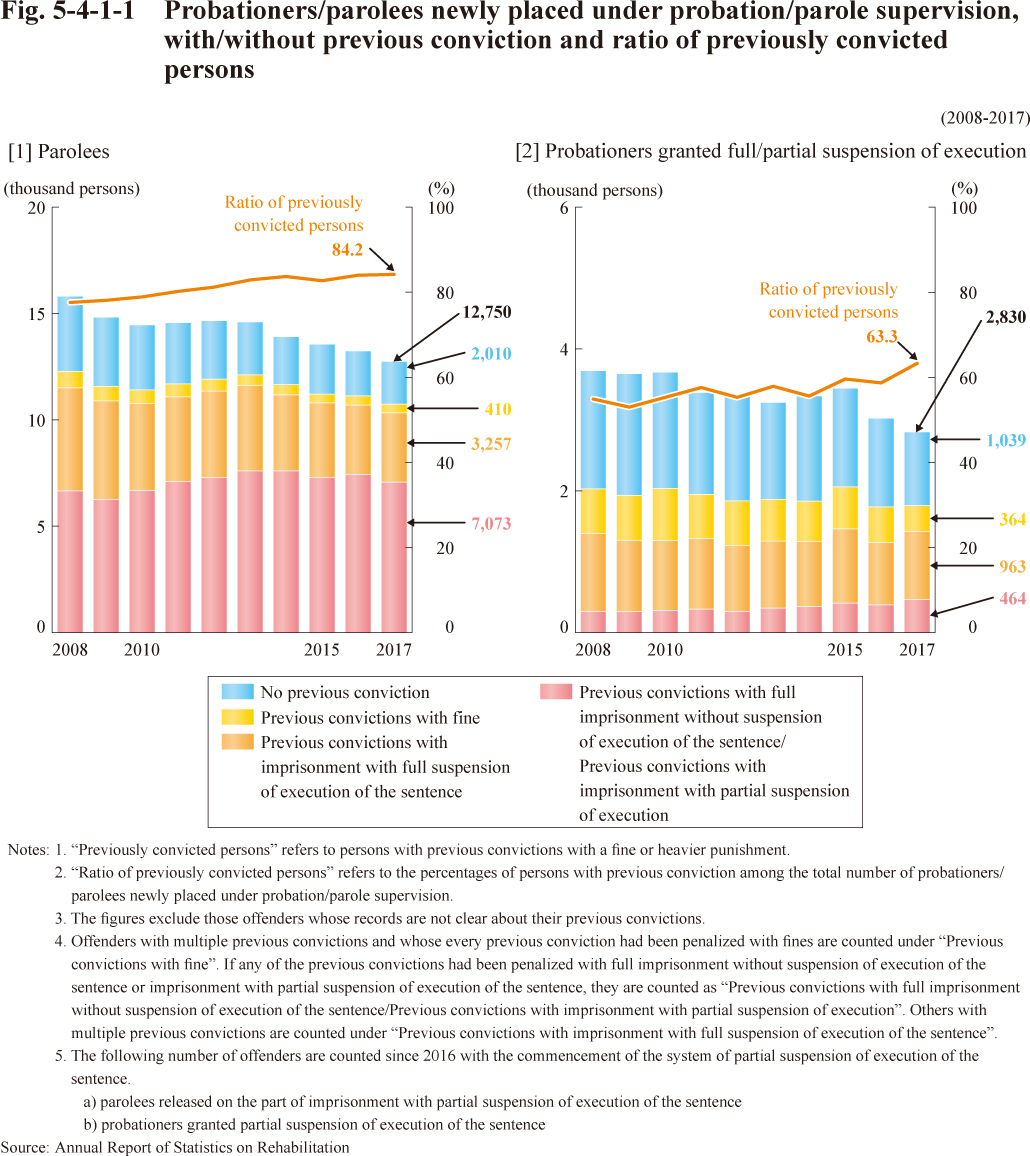
Section 1 Probationers and Parolees with Previous Convictions
Section 2 Redisposition or Revocation during Probation / Parole Supervision
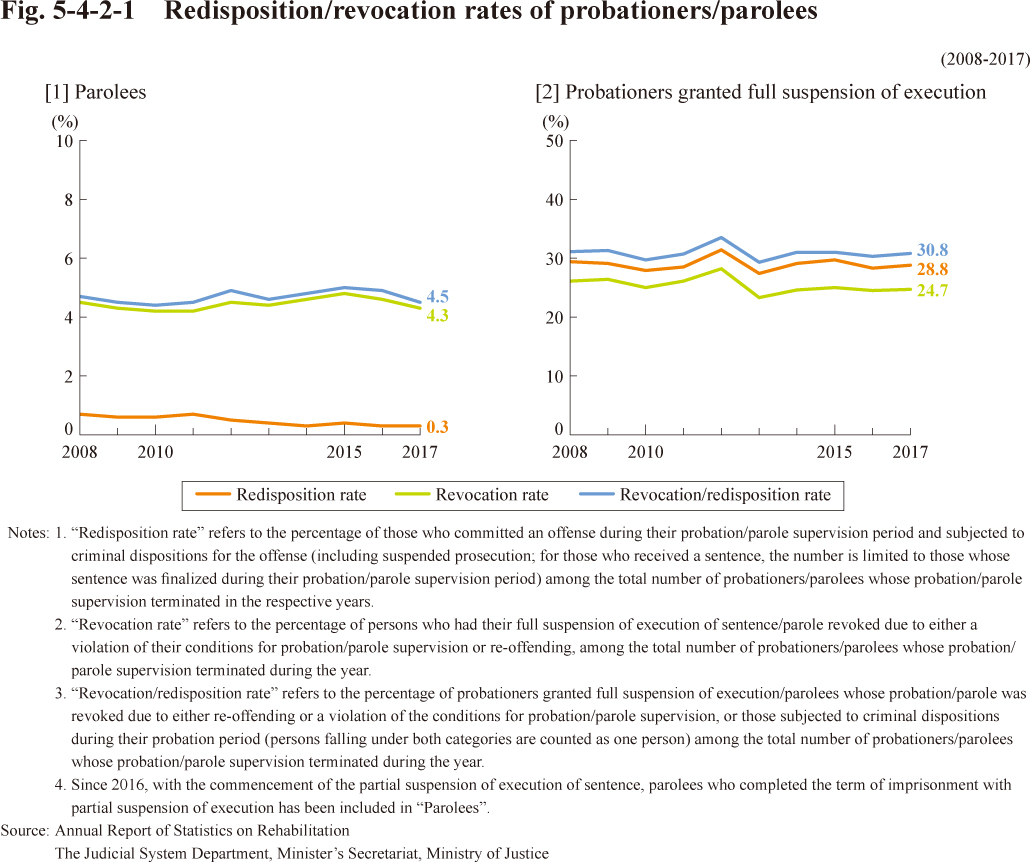 Fig. 5-4-2-1 Redisposition/revocation rates of probationers/parolees
PART 6 Crime Victims
Chapter 1 Crime Victimization
Section 1 Number of Cases Involving Human Victims

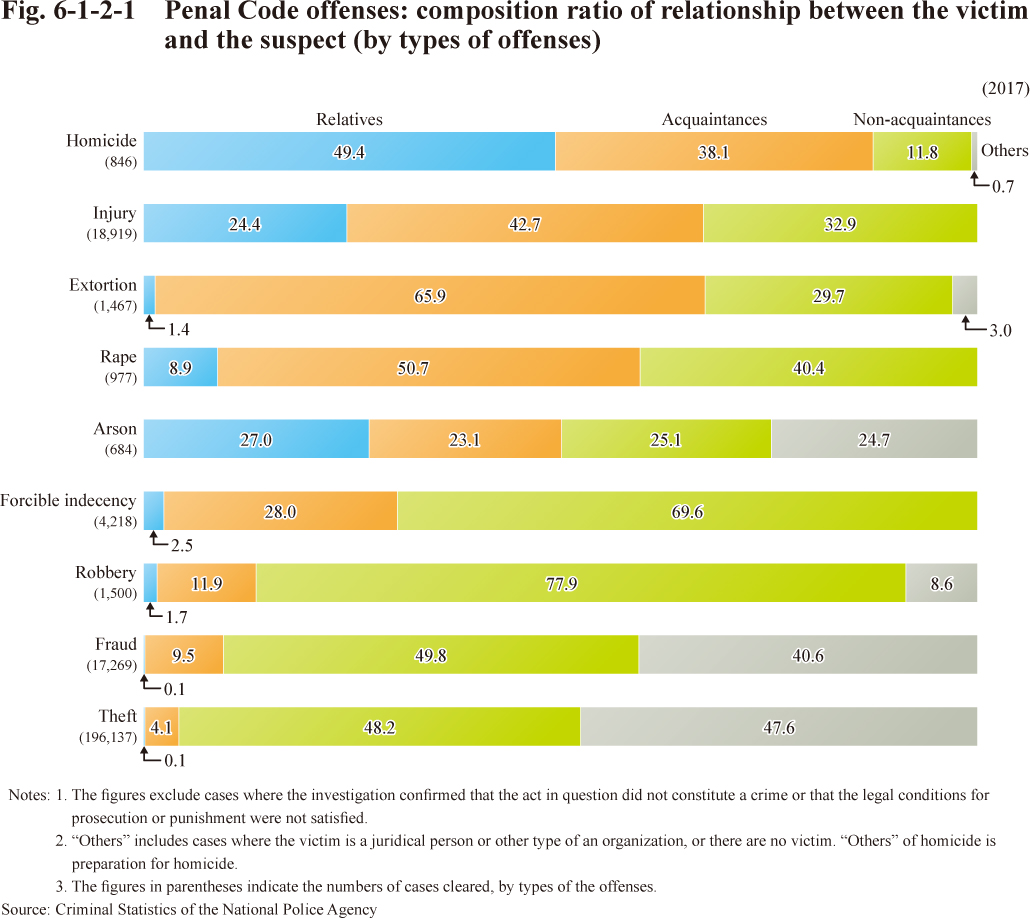
Section 2 Relationship between Victims and Suspects
Chapter 2 Victims in Criminal Justice Process
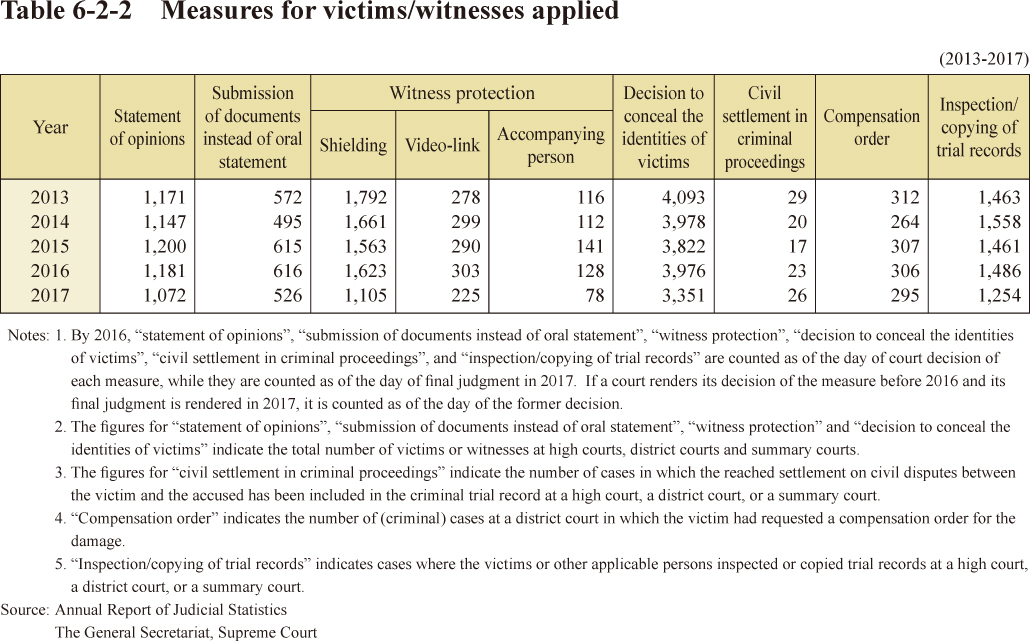
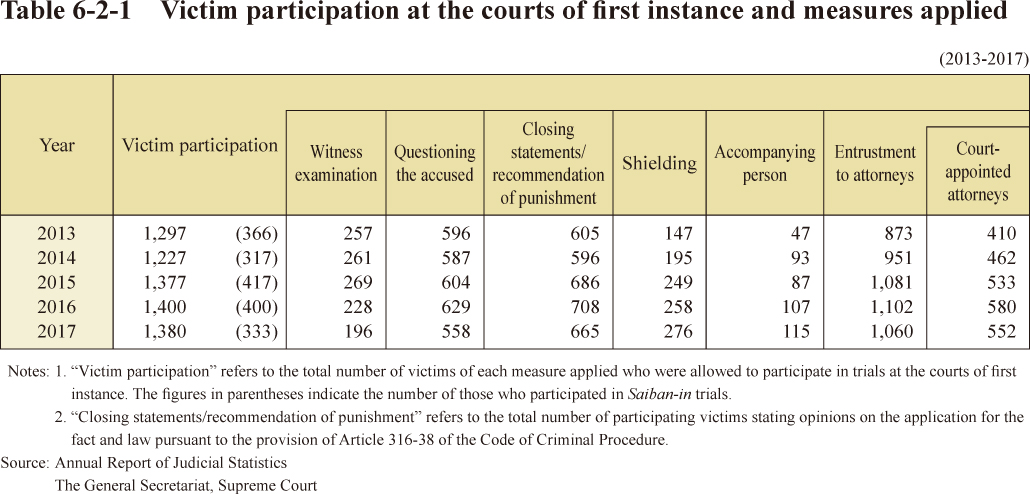 Table 6-2-1 Victim participation at the courts of first instance and measures applied