3 Characteristics of new sentenced inmates
(1) Age
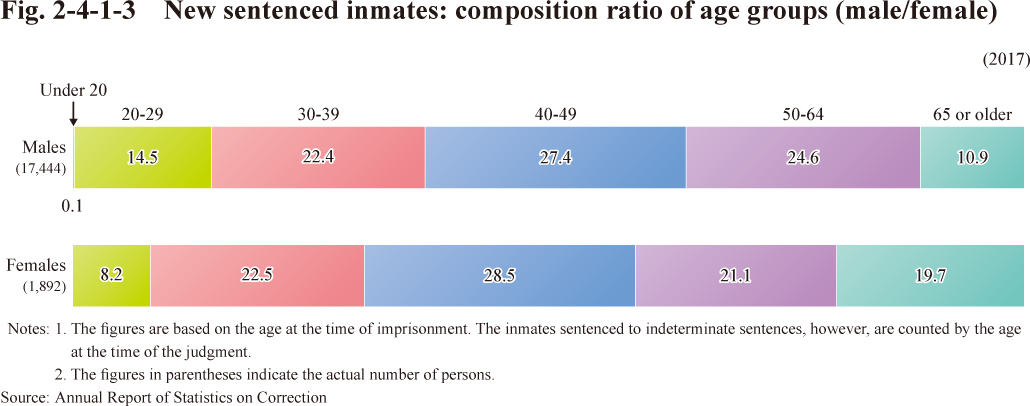
Fig. 2-4-1-3 shows the composition ratio of age groups of new sentenced inmates in 2017, by gender.
Fig. 2-4-1-3 New sentenced inmates: composition ratio of age groups (male/female)
(2) Types of offenses
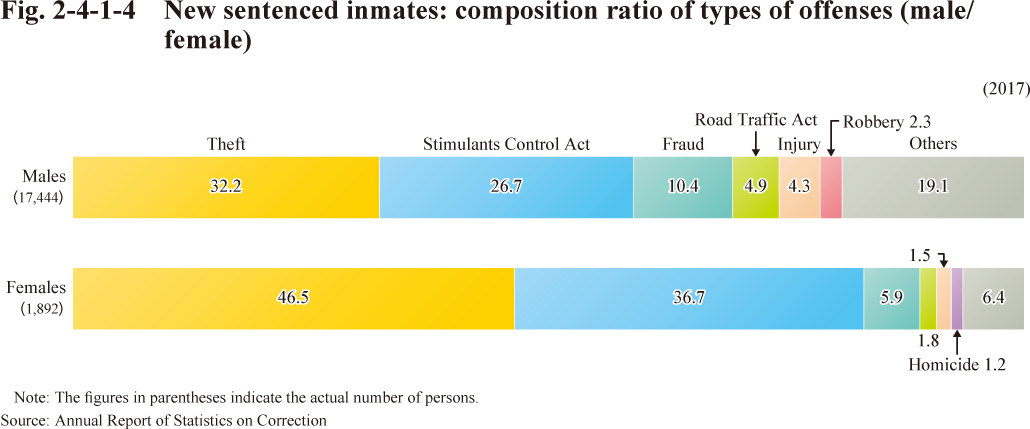
Fig. 2-4-1-4 shows the composition ratio of types of offenses committed by new sentenced inmates in 2017, by gender.
Fig. 2-4-1-4 New sentenced inmates: composition ratio of types of offenses (male/female)