2 Reimprisonment of released inmates
Fig. 4-1-3-2 shows the cumulative percentage of reimprisonment (the cumulative percentage of prisoners who were released in a particular year and subsequently reimprisoned by the end of each year; hereinafter the same in this subsection) of inmates released in 2003 and 2008 for a period of five and 10 years after release, inclusive of the year of release, by reason for release (on completion of their term of imprisonment or on parole).
Fig. 4-1-3-2 Cumulative percentage of reimprisonment of released inmates by reason for release
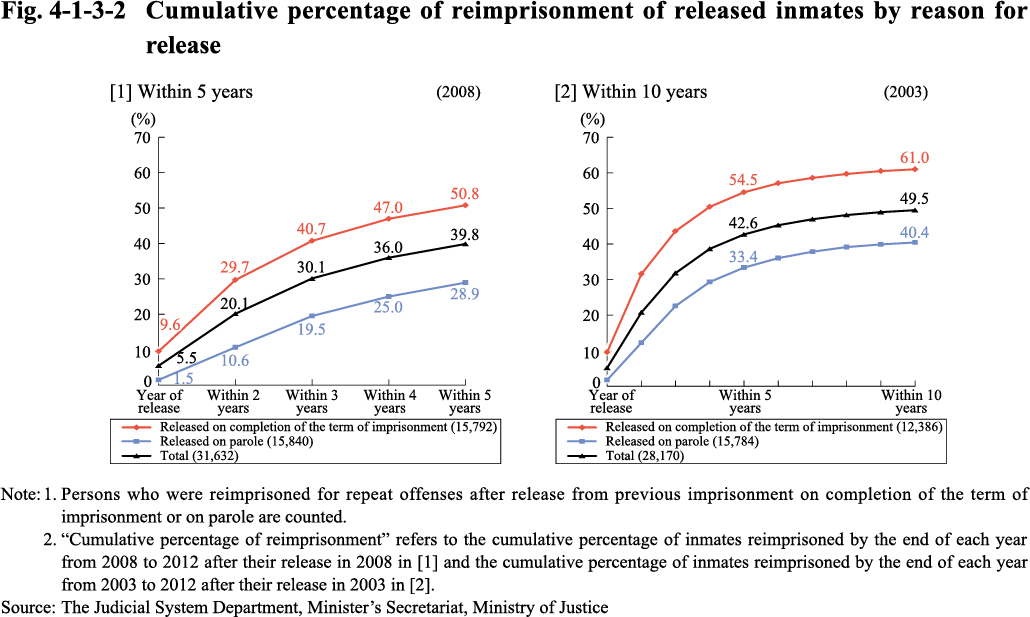
Fig. 4-1-3-3 shows the cumulative percentage of reimprisonment of inmates released in 2008 by type of offense.
Fig. 4-1-3-3 Cumulative percentage of reimprisonment of released inmates within 5 years by reason for release and type of offense (2008)
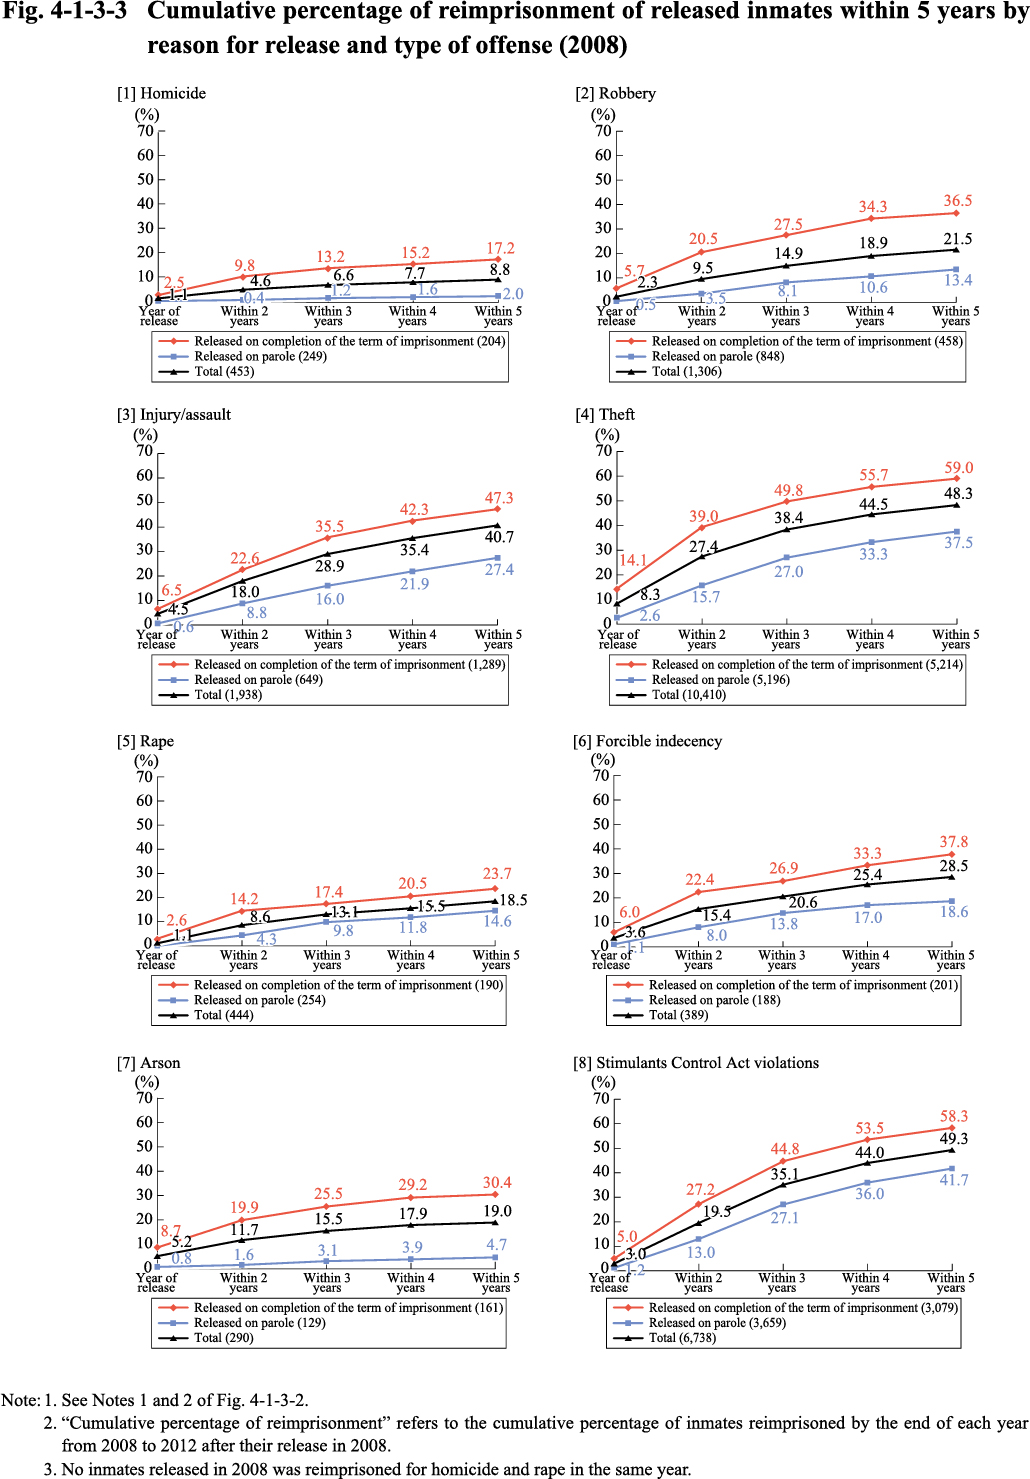
Fig. 4-1-3-4 shows the cumulative percentage of reimprisonment of released inmates by history of imprisonment.
Fig. 4-1-3-4 Cumulative percentage of reimprisonment of released inmates by history of imprisonment
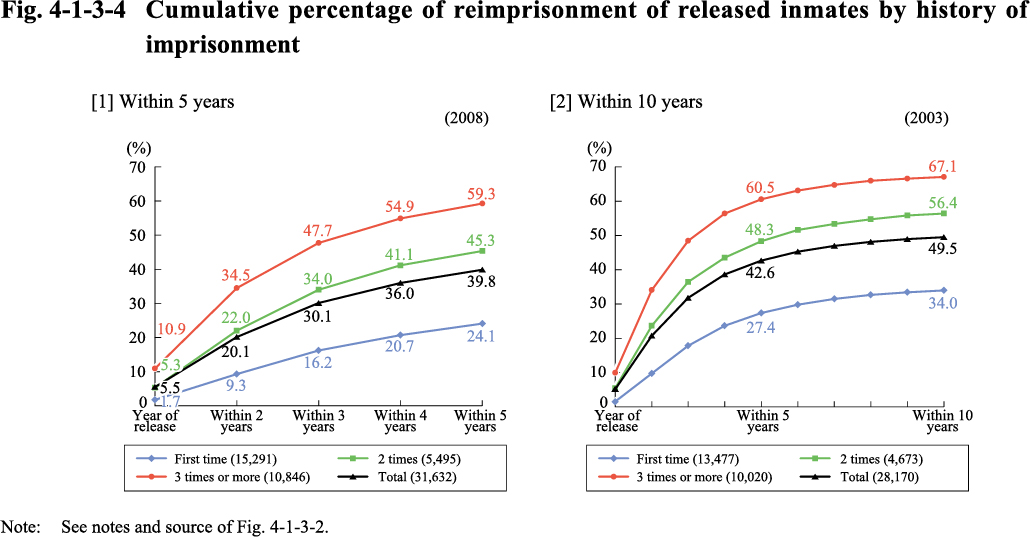
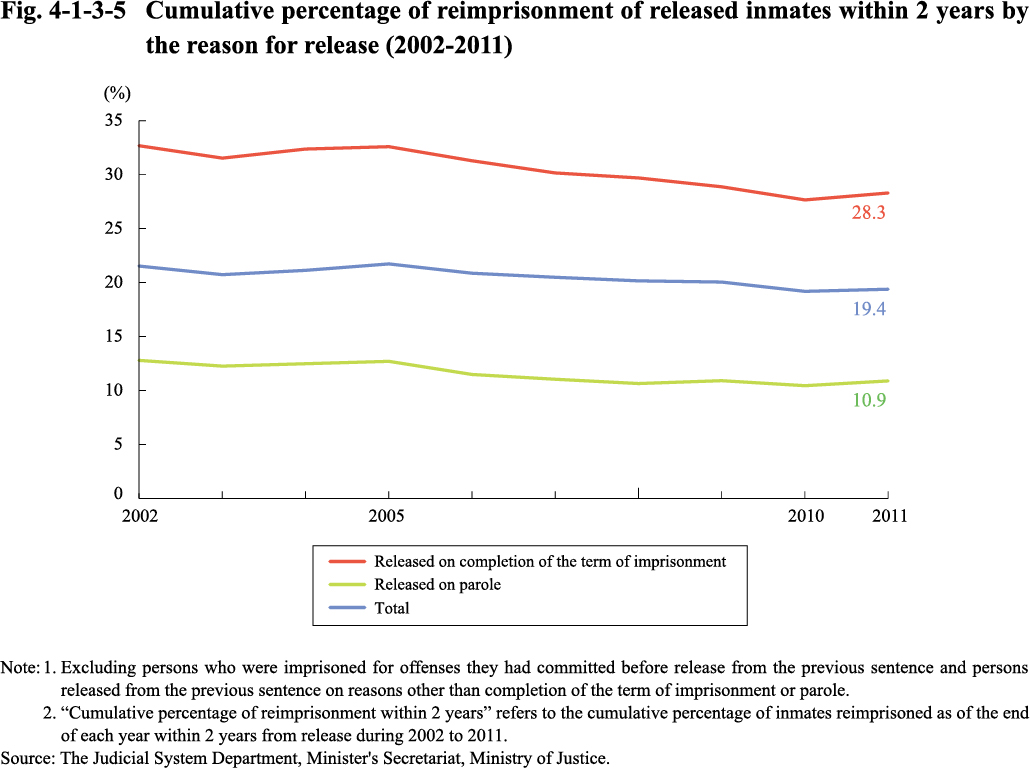
Fig. 4-1-3-5 shows the trend of the two-year reimprisonment rate by year of release and by reason of release.
Fig. 4-1-3-5 Cumulative percentage of reimprisonment of released inmates within 2 years by the reason for release (2002-2011)