4 Characteristics of new inmates
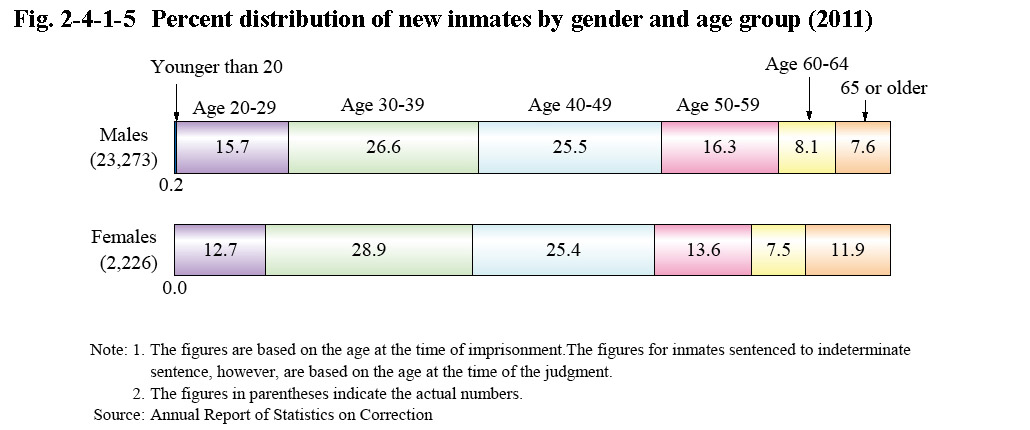
(1) Age
Fig. 2-4-1-5 shows the percent distribution of new inmates in 2011 by gender and age group. Those aged 30-39 accounted for the highest proportion with both males and females, followed by those aged 40-49. The proportion of elderly inmates aged 65 or older was higher with females than males.
Fig. 2-4-1-5 Percent distribution of new inmates by gender and age group (2011)
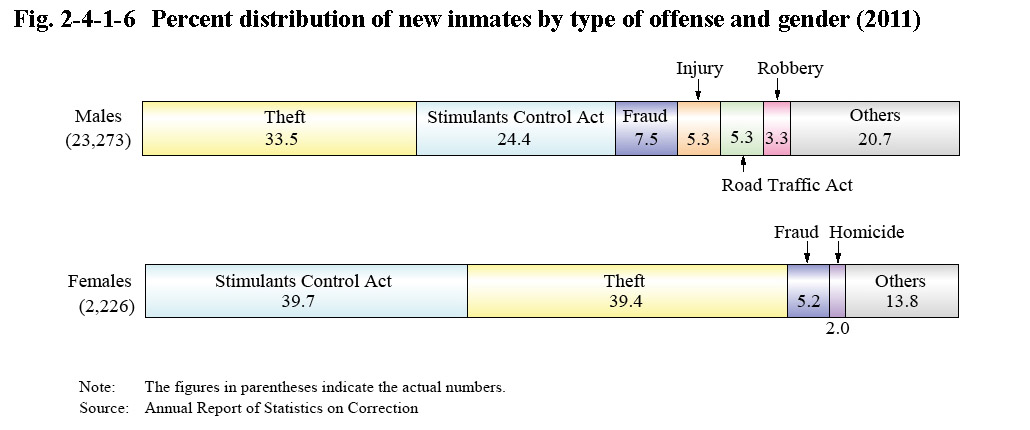
(2) Type of offense
Fig. 2-4-1-6 shows the percent distribution of new inmates in 2011 by type of offense and gender. With males, theft accounted for the highest proportion at 33.5%, followed by Stimulants Control Act violations at 24.4%, fraud at 7.5%, and then injury and Road Traffic Act violations each at 5.3%. With females, Stimulants Control Act violations accounted for the highest proportion at 39.7%, followed by theft at 39.4%, fraud at 5.2%, and homicide at 2.0% (See Appendix 2-6).
Fig. 2-4-1-6 Percent distribution of new inmates by type of offense and gender (2011)
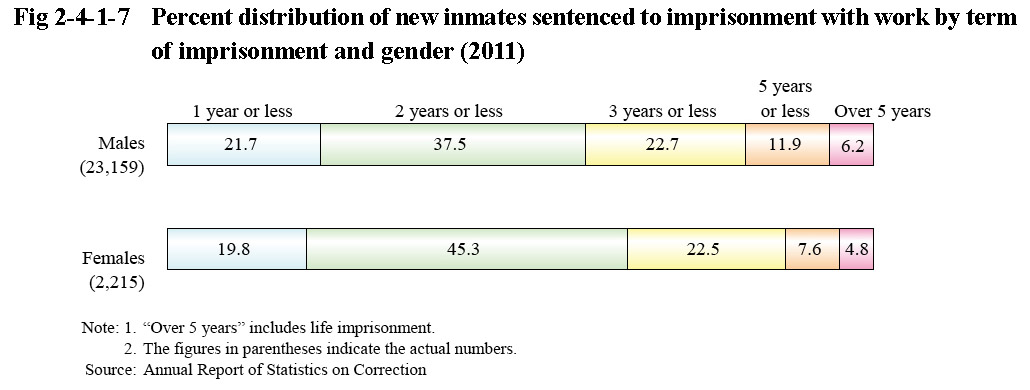
(3) Type of sentence and term of imprisonment
Examining the type of sentence of new inmates in 2011 revealed that 25,374 persons (99.5%) were sentenced to imprisonment with work, 121 (0.5%) to imprisonment without work, and four to misdemeanor imprisonment without work (Source: Annual Report of Statistics on Correction). Fig. 2-4-1-7 shows the percent distribution of new inmates by the term of their imprisonment and gender in 2011 (See Appendix 2-10 for the number of inmates sentenced to imprisonment with work as of the end of the respective years by the term of imprisonment).
Fig. 2-4-1-7 Percent distribution of new inmates sentenced to imprisonment with work by term of imprisonment and gender (2011)