3 Number of new inmates
Fig. 2-4-1-3 shows the number of new inmates over the last 20 years. After reaching a post WWII low level of 20,864 in 1992 the number started to consistently increase, but then continued decreasing every year from 2007, and was 25,499 in 2011 (down 5.8% from the previous year). The number of new female inmates was 914 in 1992 but then continued increasing up to 2,333 in 2006. It remained at the high level of 2,226 in 2011 (up 0.9% (id.)), or approximately 2.4 times that of 1992.
Fig. 2-4-1-3 Number and rate per population of new inmates by gender (1992-2011)
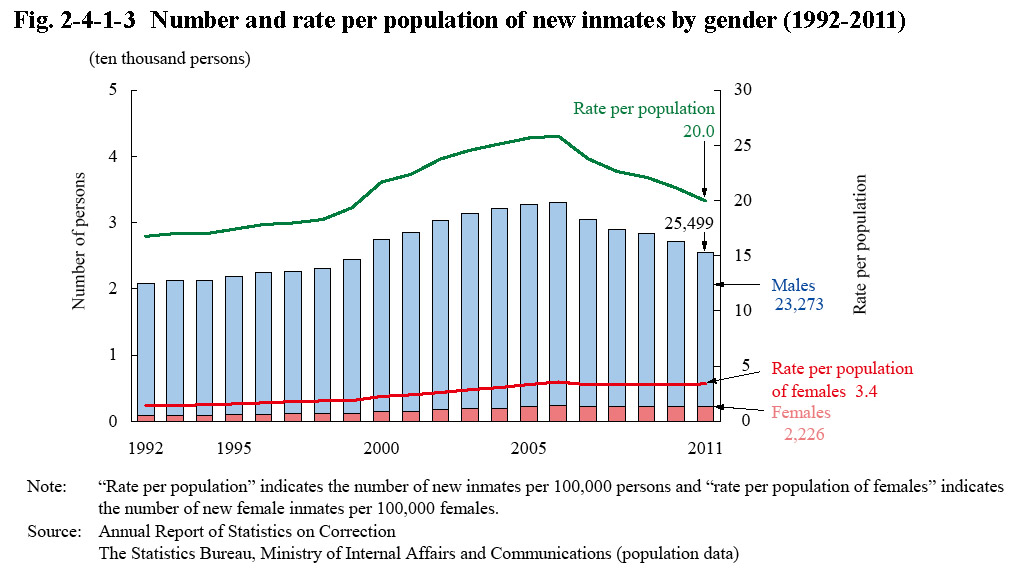
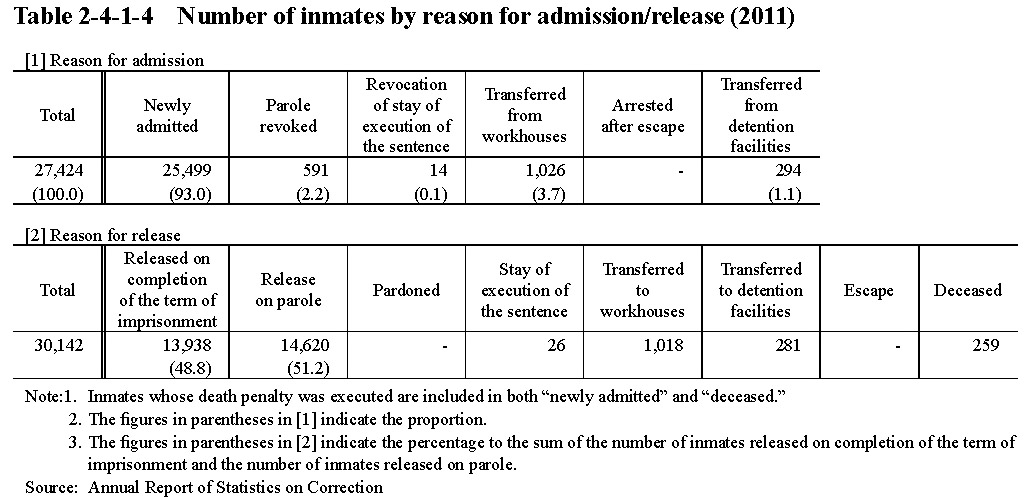
Table 2-4-1-4 shows the number of inmates by reason for admission/release in 2011.
Table 2-4-1-4 Number of inmates by reason for admission/release (2011)