3 Prosecution in public prosecutors offices
Fig. 7-2-2-5 and Fig. 7-2-2-6 show the rate per population of persons prosecuted and the suspended prosecution rate, for non-traffic penal code offenses by age group (based on their age at the time of the offense) since 1989.
The rate per population of persons prosecuted consistently remained the highest with the age group of 20-24, the age group of 25-29, and the age group of 30-49, in that order, and with the rate per population of those in these age groups exceeding that of the total for all age groups. In contrast to this, however, the suspended prosecution rate for those aged 25-29 was lower than that of the total for all age groups from 1989 (the same with those aged 30-49) while that of those aged 20-24 was at almost the same level as that of the total for all age groups. Note, however, that the rate per population of juveniles prosecuted and the suspended prosecution rate for juveniles were affected by provisions of the Juvenile Act and therefore cannot simply be compared with that of adults.
Fig. 7-2-2-5 Rate per population of persons prosecuted for non-traffic penal code offenses by age group (1989-2010)
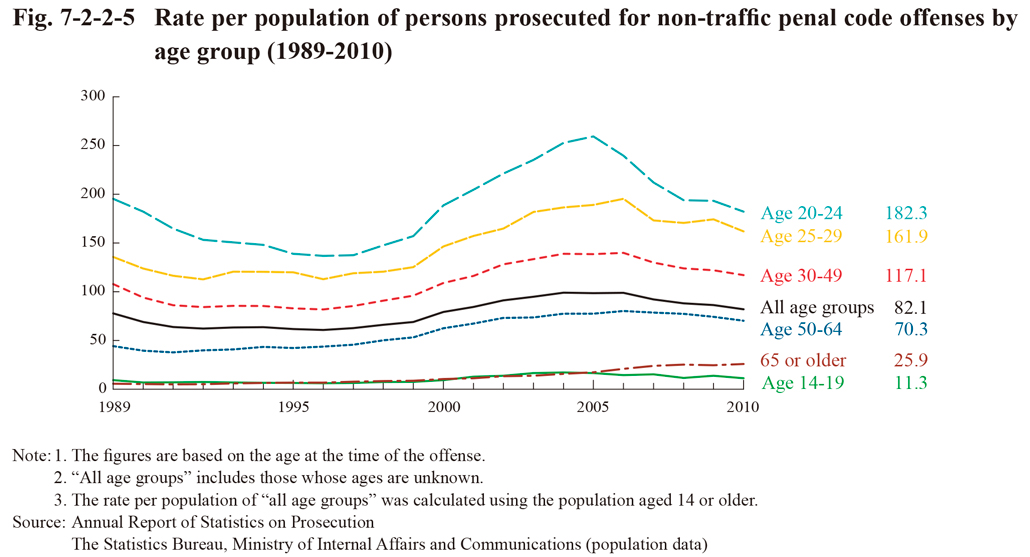
Fig. 7-2-2-6 Suspended prosecution rate for non-traffic penal code offenses by age group (1989-2010)
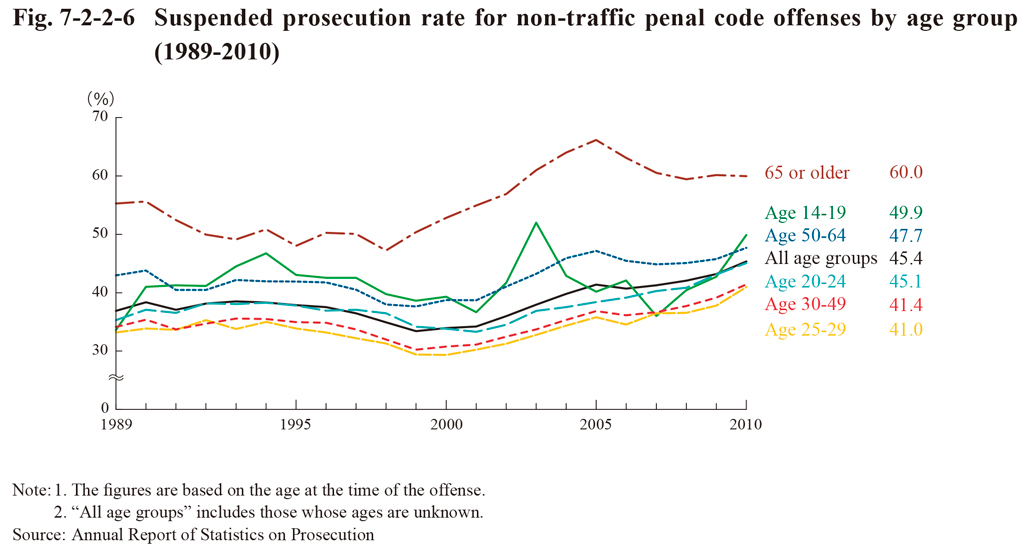
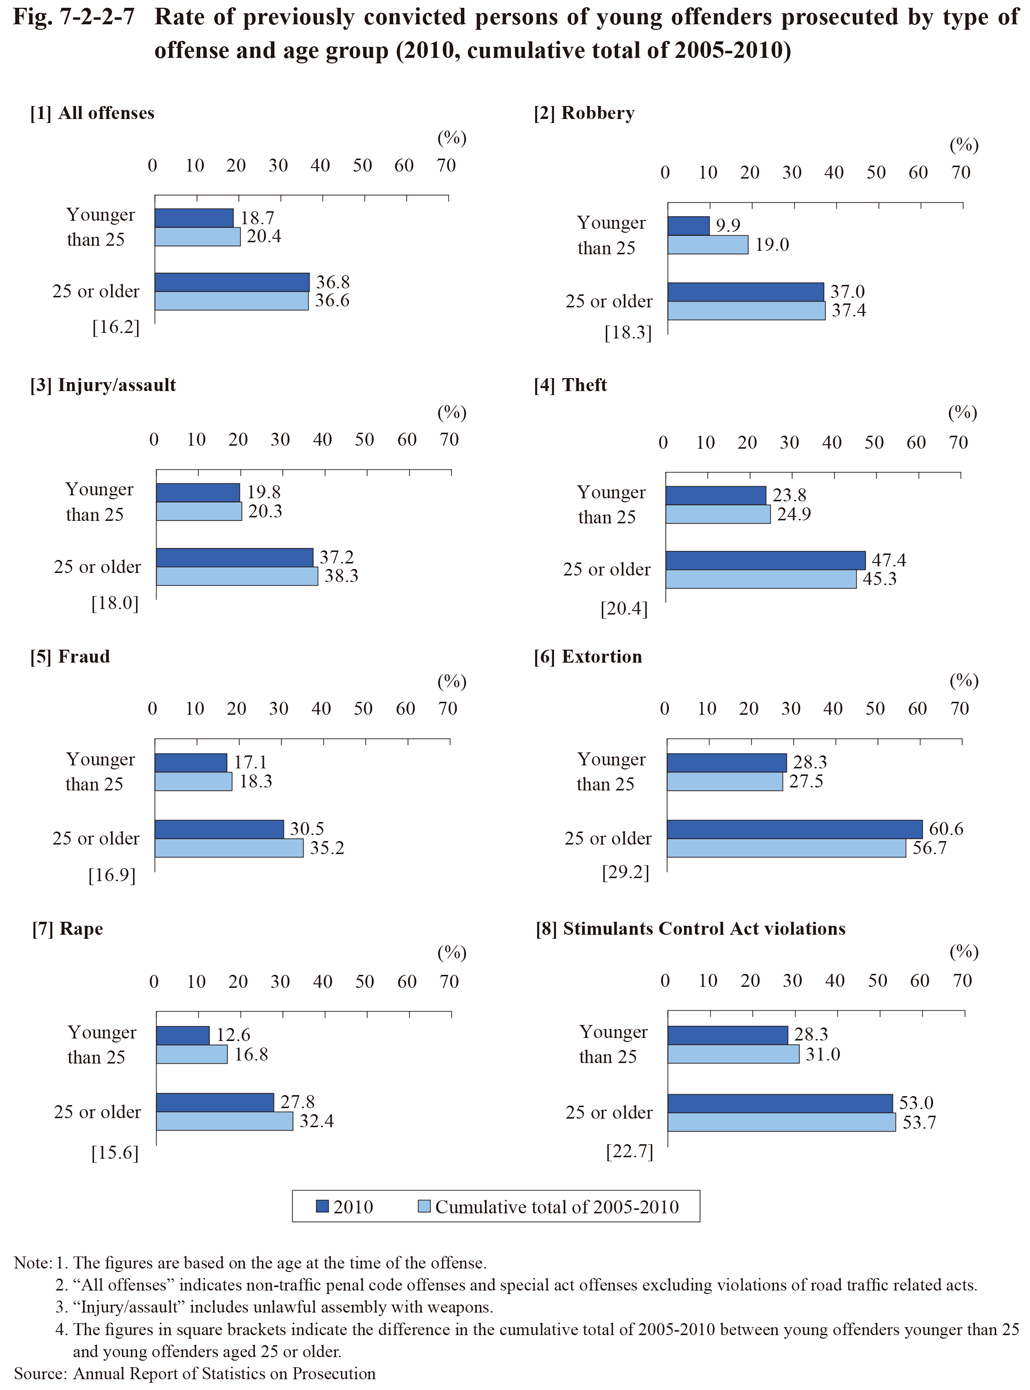
Fig. 7-2-2-7 shows the percentage of those with previous convictions (hereinafter referred to as the “rate of previously convicted persons” in this subsection) to total young offenders prosecuted, for major offenses (younger than 25 / 25 or older).
With young offenders younger than 25, the rate of previously convicted persons was high for theft, extortion, and Stimulants Control Act violations when compared with that for all offenses (non-traffic penal code offenses and special act offenses excluding violations of road traffic related acts). This trend was even more markedly observed with young offenders aged 25 or older, and the rate of previously convicted persons for theft, extortion, and Stimulants Control Act violations all were clearly higher at around or exceeding 50%.
In addition, the number of persons with previous convictions generally increased as the age of the group rose, thus making the rate of previously convicted persons of young offenders aged 25 or older naturally higher than that of those younger than 25. However, the difference, in the cumulative total for 2005-2010, of the rate of previously convicted persons, between those age groups, for extortion and Stimulants Control Act violations were remarkably large at 29.2 and 22.7 points, respectively, when compared with that for all offenses (16.2 points). That for theft was similarly large at 20.4 points. Young offenders are considered to tend to repeat these offenses.
Fig. 7-2-2-7 Rate of previously convicted persons of young offenders prosecuted by type of offense and age group (2010, cumulative total of 2005-2010)