2 Special act offenses
(1) Number of persons referred to public prosecutors
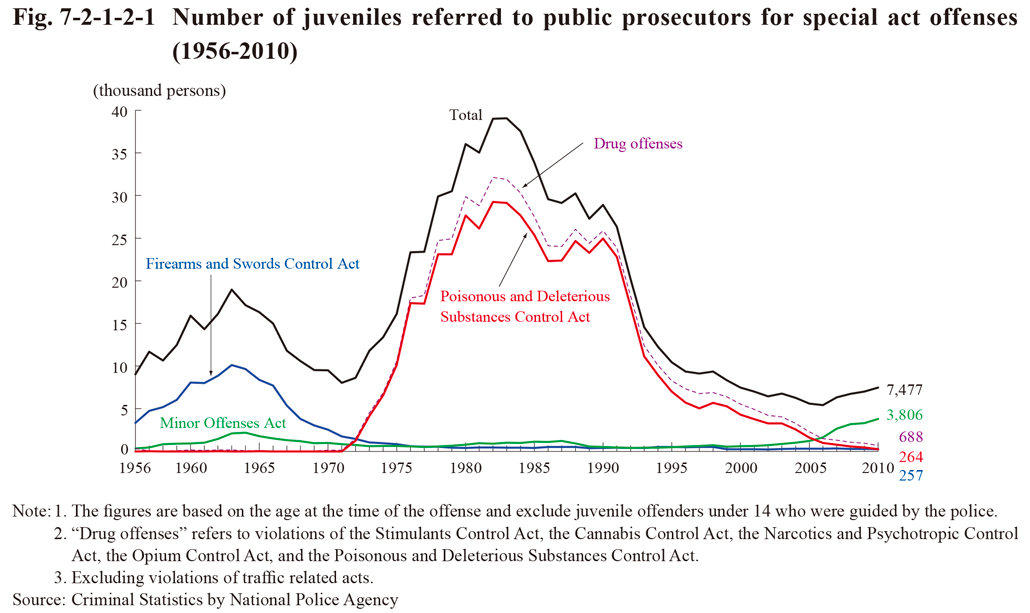
Fig. 7-2-1-2-1 shows the number of juvenile offenders (for special act offenses excluding violations of traffic related acts) referred to public prosecutors since 1956 (See Appendix 7-6 for the number of persons referred to public prosecutors by type of offense). The number peaked at 18,967 in 1963 and then again at 39,062 in 1983, but following which it continued to be on a decreasing trend. However, it then constantly increased from 2007, and was 7,477 in 2010 (up 6.8% from the previous year). By type of offense, the number was large for Firearms and Swords Control Act violations from 1955 through to around 1969, with the number for drug offenses remaining at a high level from around 1970, but both of which in recent years were on a decreasing trend. In contrast to this, the number of persons referred to public prosecutors for Minor Offenses Act violations sharply increased from 2007 and was 3,806 in 2010 (up 15.2% (id.)), and accounted for the highest percentage of special act offenses at 50.9%.
Fig. 7-2-1-2-1 Number of juveniles referred to public prosecutors for special act offenses (1956-2010)
(2) Drug offenses
Poisonous and Deleterious Substances Control Act violations accounted for the vast majority of drug offenses committed by juveniles since the said Act was first amended in 1972 to thereby criminalize paint-thinner abuse, etc. The number of juveniles referred to public prosecutors for violations of the said Act decreased sharply around 1993, after reaching a peak in 1982 at 29,254, and continued to decrease to 264 in 2010 (down 43.3% from the previous year) (See Fig. 7-2-1-2-1 and Appendix 7-6).
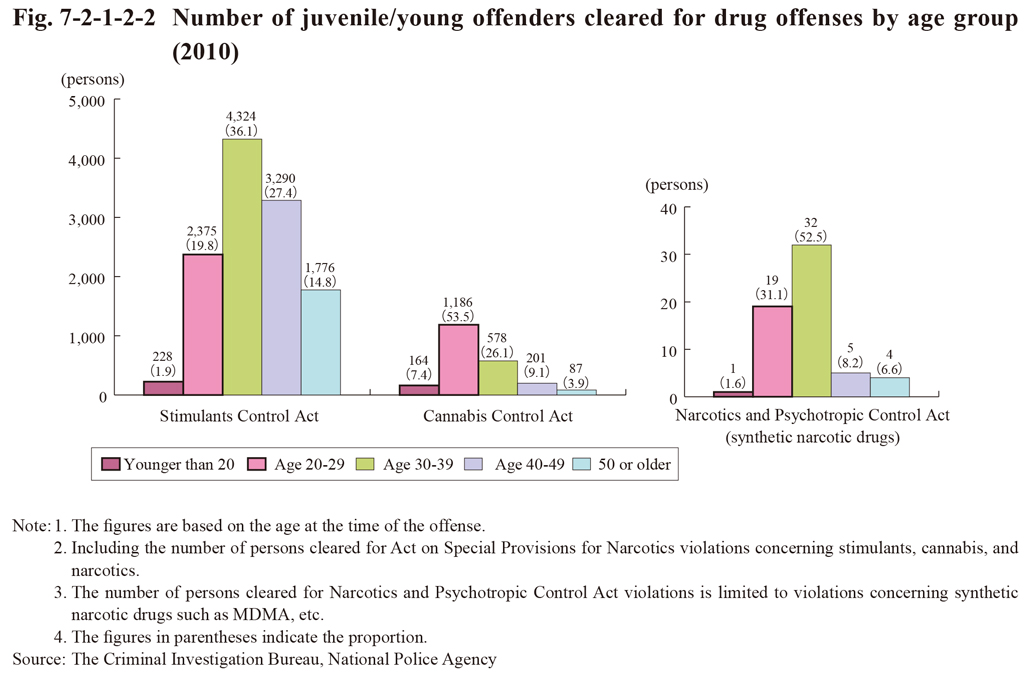
Fig. 7-2-1-2-2 shows the number and percent distribution of persons cleared for violations of the Stimulants Control Act, Cannabis Control Act, and Narcotics and Psychotropic Control Act (limited to violations involving synthetic narcotic drugs such as MDMA, etc.) by age group in 2010. The proportion of juvenile/young offenders cleared to total persons cleared for Stimulants Control Act violations were 1.9% and 19.8%, respectively, whereas that for Cannabis Control Act violations were high at 7.4% and 53.5%, respectively.
Fig. 7-2-1-2-2 Number of juvenile/young offenders cleared for drug offenses by age group (2010)
(3) Traffic offenses
a. General trends
Fig. 7-2-1-2-3 shows the number of notified cases (cases notified under the traffic infraction notification system as non-criminal offenses) and referred cases (cases referred to public prosecutors as criminal offenses) for violations of road traffic related acts committed by juveniles since 1989. The numbers were both decreasing and were 258,464 (down 8.8% from the previous year) and 32,444 (down 8.5% (id.)), respectively in 2010.
Fig. 7-2-1-2-3 Number of notified/referred cases for violations of road traffic related acts committed by juveniles (1989-2010)
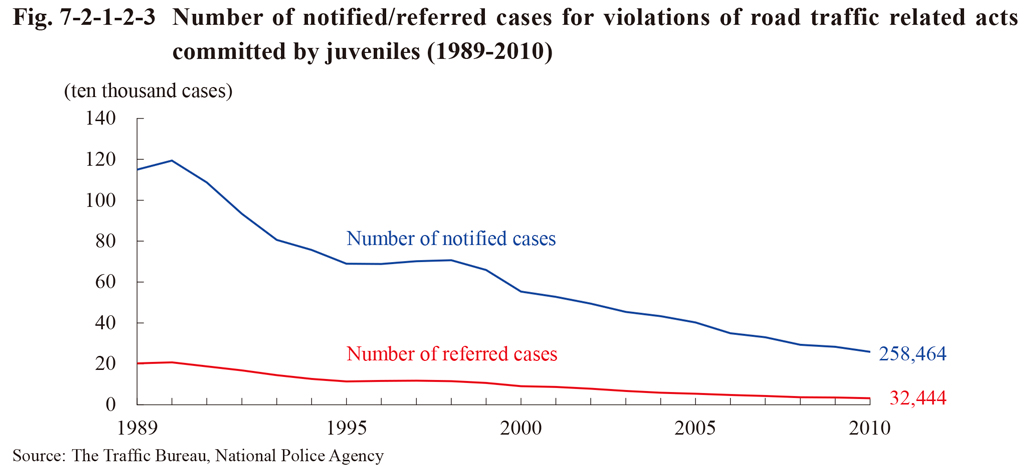
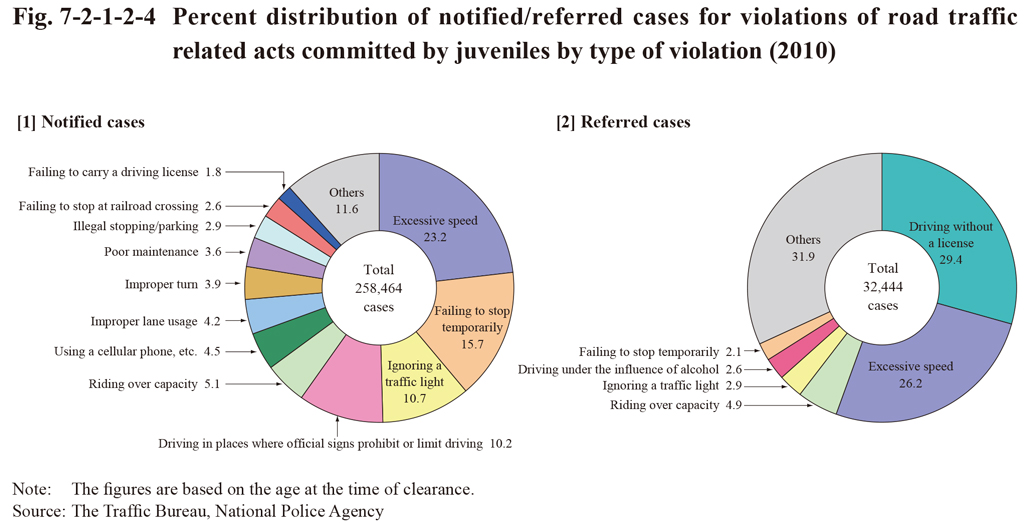
Fig. 7-2-1-2-4 shows the percent distribution of notified/referred cases for violations of road traffic related acts committed by juveniles by type of violation in 2010. Driving without a license accounted for the highest proportion of referred cases at 29.4%, which was remarkably high when compared to adults (5.5%) (Source: The Traffic Bureau, National Police Agency).
Fig. 7-2-1-2-4 Percent distribution of notified/referred cases for violations of road traffic related acts committed by juveniles by type of violation (2010)
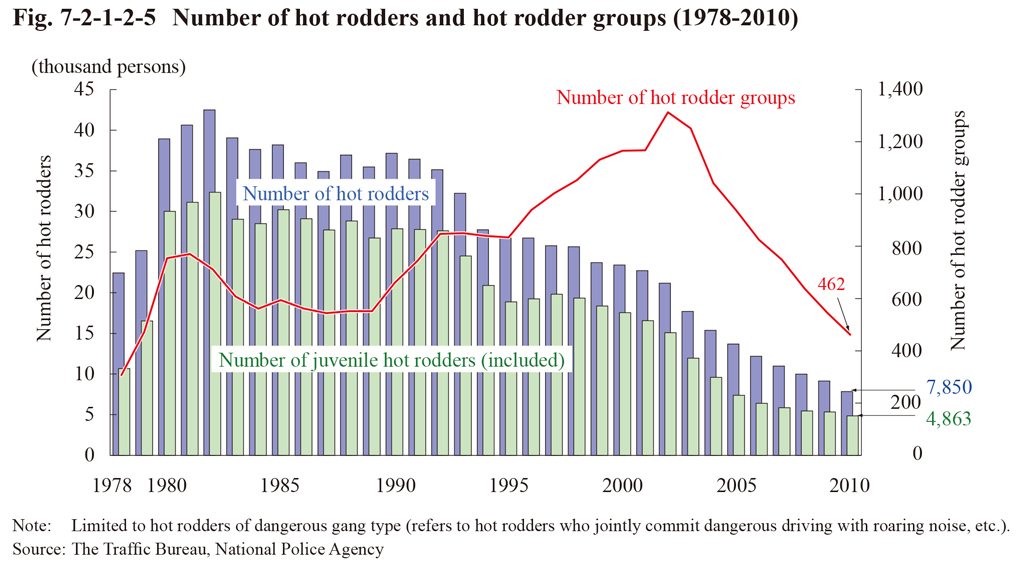
b. Hot rodders
Fig. 7-2-1-2-5 shows the number of hot rodders and hot rodder groups since 1978. The number of hot rodders was decreasing after reaching a peak of 42,510 in 1982, and was 7,850 in 2010 (down 14.1% from the previous year). Similarly, the number of juvenile hot rodders was also decreasing from 1998, and was 4,863 in 2010 (down 9.0% from the previous year). The percentage of juveniles to total hot rodders was on a declining trend after reaching a peak in 1986, but was rising from 2007. In contrast to this, the number of hot rodder groups continued to increase from around 1989, but turned to be on a decreasing trend after reaching a peak of 1,313 in 2002, and was 462 in 2010 (down 15.2% from the previous year). The size of hot rodder groups was shrinking in recent years. In 2010 groups with less than 30 members accounted for 98.7% of the total (Source: The Traffic Bureau, National Police Agency).
Fig. 7-2-1-2-5 Number of hot rodders and hot rodder groups (1978-2010)