Chapter 2 Trends with Juvenile/Young Offenders
Section 1 Guidance/Clearance
1 Penal code offenses
(1) Number of persons cleared
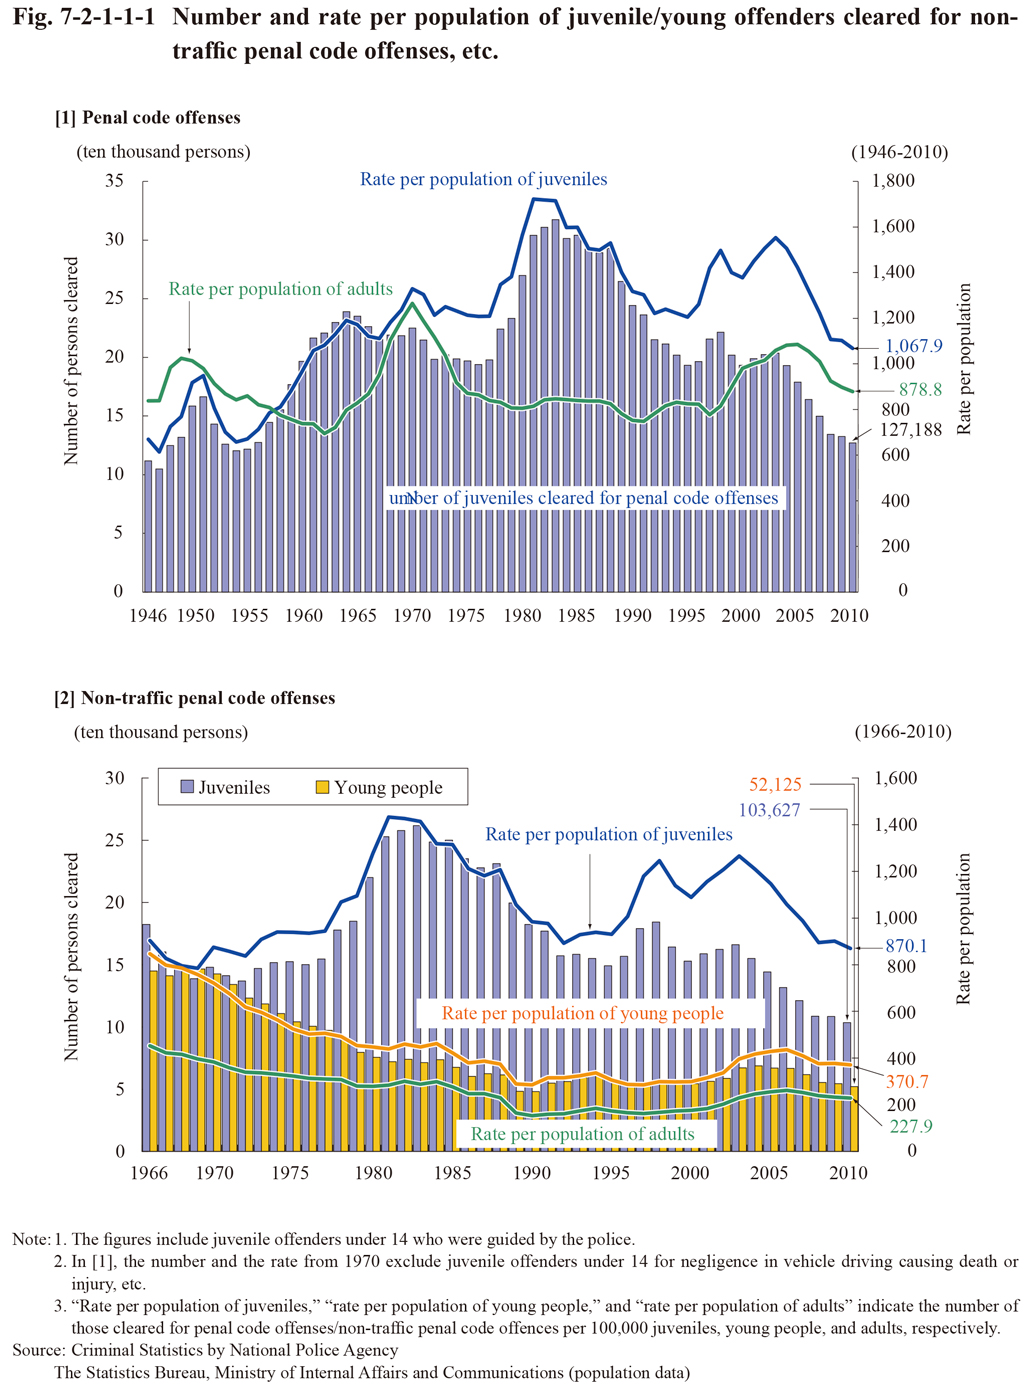
Fig. 7-2-1-1-1 [1] shows the number of juveniles cleared for penal code offenses (including juvenile offenders under 14 guided by the police; hereinafter the same in this section, unless specified otherwise) and rate per population since 1946 (See Appendix 7-1). There were three peaks with the trends in the number of juveniles cleared for penal code offenses: the first being in 1951 at 166,433, the second in 1964 at 238,830, and the third in 1983 at 317,438. From 1984, however, the number was on a decreasing trend until 1995. After going through some slight ups and downs it then continued to decrease every year from 2004 and was 127,188 in 2010 (down 4.1% from the previous year). The rate per population also continued to decline every year from 2004 through to 2010. The number of juveniles cleared in 2010 was basically at the same level as around 1955 whereas the rate per population was at a similar level to around 1964 at the second peak.
Fig. 7-2-1-1-1 [2] shows the number and rate per population of juveniles and young people cleared for non-traffic penal code offenses since 1966 (See the Appendices for cleared adults). Around 1970, the number and rate per population of young people cleared were at the same level as that of juveniles, but continued to decrease/decline until around 1989 to fall far below those of juveniles, and then remained stable. However, the number of young people cleared increased over four consecutive years from 2001 and the rate per population rose for seven consecutive years from 2000, but then turned to a decreasing/declining trend again. In 2010 the number was 52,125 (down 4.3% from the previous year) and the rate per population 370.7 (down 7.0 points (id.)). The number and rate per population of juveniles cleared were decreasing/declining since 2004, and were 103,627 (down 4.4% from the previous year) and 870.1 (down 30.8 points (id.)) in 2010, respectively. The difference between juveniles and young people grew quite small in recent years when compared to around 1989.
The number of juvenile offenders under 14 guided by the police for non-traffic penal code offenses was on a decreasing trend after reaching three peaks in 1951, 1962, and 1981 (67,906 persons). It remained within the range of 20 to 23 thousand from 1999, and fell below 20 thousand for the first time after 1950 in 2006. It further decreased to 17,727 in 2010 (down 1.7% from the previous year) (See Appendix 7-4).
Fig. 7-2-1-1-1 Number and rate per population of juvenile/young offenders cleared for non-traffic penal code offenses, etc.
(2) Trends by attribute
a. Trends by age group
Fig. 7-2-1-1-2 shows the number and rate per population of juveniles cleared for non-traffic penal code offenses by age group since 1966 (See Appendix 7-2). The number and rate per population were both generally on a decreasing/declining trend across all age groups from 2004. The order of the rate per population was also consistent from 1984, with the highest being junior juveniles, followed by intermediate juveniles, and senior juveniles, and then juvenile offenders under 14.
Fig. 7-2-1-1-2 Number and rate per population of juveniles cleared for non-traffic penal code offenses by age group (1966-2010)
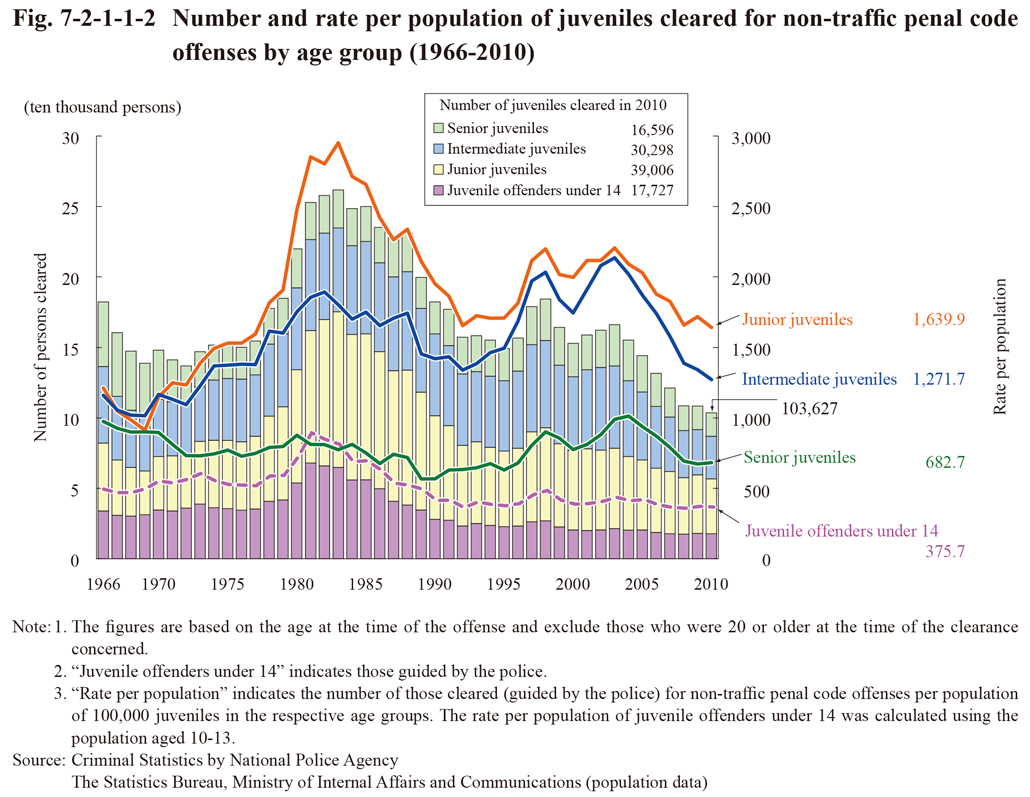
Fig. 7-2-1-1-3 shows the percent distribution of persons cleared for non-traffic penal code offenses by age group in 2010. The proportion of juveniles and young people was 26.8% and 16.1%, respectively. When compared with that in 1989 (52.9% and 15.5%, respectively; See Fig. 7-2-1-1-5) the proportion of juveniles significantly declined but still remained at a relatively high level.
Fig. 7-2-1-1-3 Percent distribution of persons cleared for non-traffic penal code offenses by age group (2010)
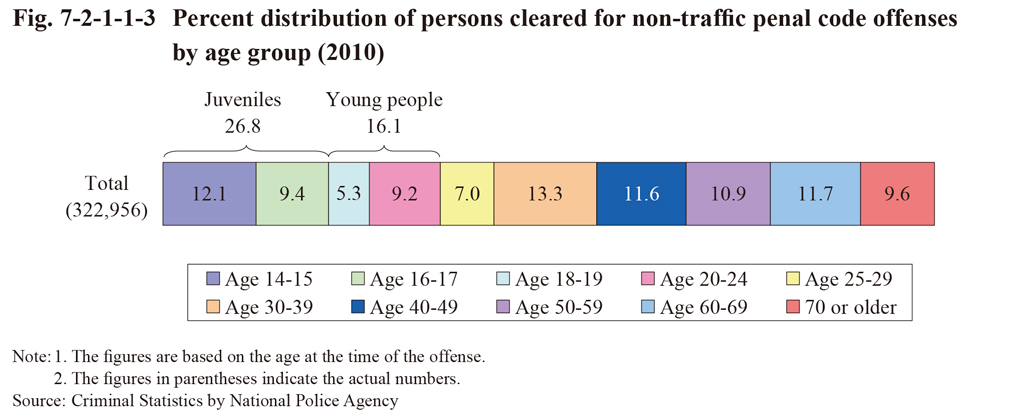
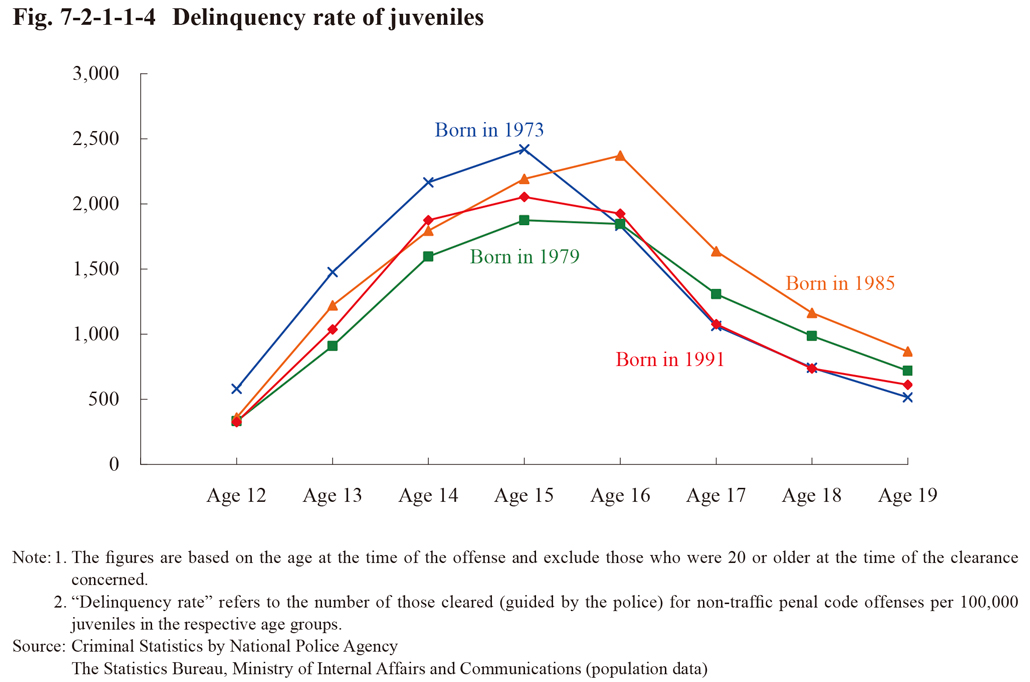
Fig. 7-2-1-1-4 shows the delinquency rate (number of those cleared (guided by the police) for non-traffic penal code offenses per 100,000 persons in the respective age groups) at age 12 to 19 of juveniles (estimated to be) born in 1973, 1979, 1985, and 1991, which reveals how the delinquency rate changes as the juveniles mature. The delinquency rate peaked at age 16 with those born in 1985 and at age 15 with others, but then significantly declined as the age rose with all groups.
Fig. 7-2-1-1-4 Delinquency rate of juveniles
b. Trends by gender
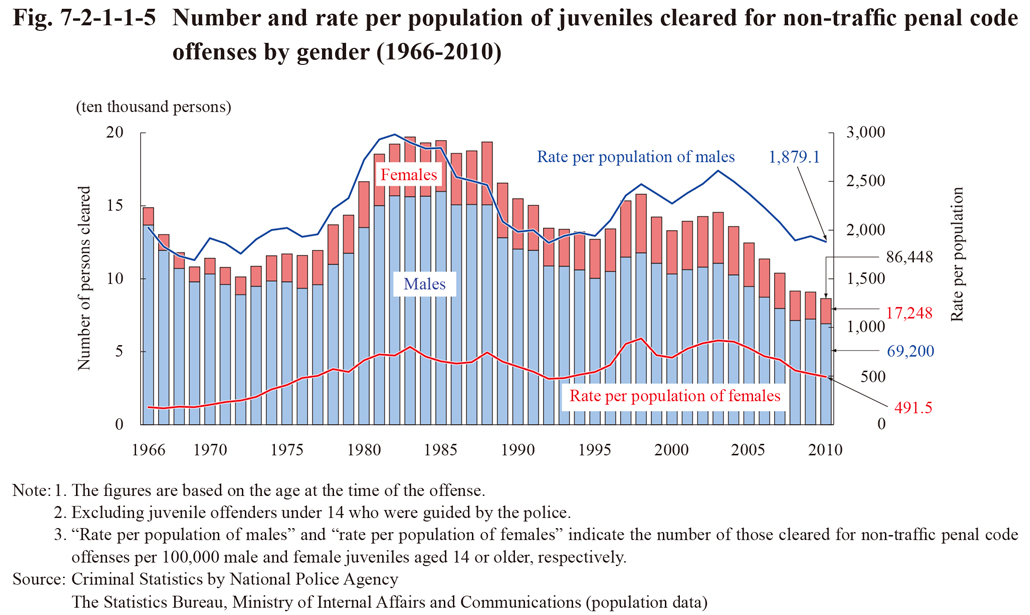
Fig. 7-2-1-1-5 shows the number and rate per population of juvenile offenders cleared (for non-traffic penal code offenses) by gender since 1966. The female rate (percentage of cleared females to total persons cleared) generally remained within the range of 18 to 25% from 1976, and was 20.0% in 2010 (down 0.5 points from the previous year).
Fig. 7-2-1-1-5 Number and rate per population of juveniles cleared for non-traffic penal code offenses by gender (1966-2010)
c. Educational/employment status
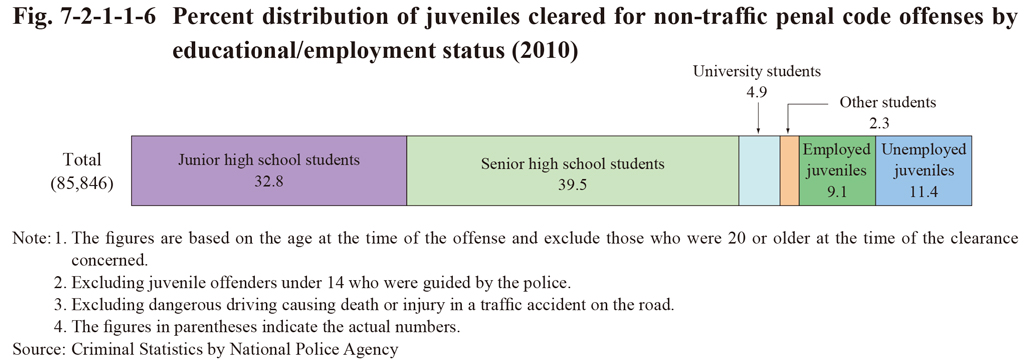
Fig. 7-2-1-1-6 shows the percent distribution of juvenile offenders cleared (for non-traffic penal code offenses excluding dangerous driving causing death or injury in a traffic accident on the road) by educational/employment status in 2010. Senior high school students accounted for the highest proportion, followed by junior high school students and unemployed juveniles in that order.
Fig. 7-2-1-1-6 Percent distribution of juveniles cleared for non-traffic penal code offenses by educational/employment status (2010)
(3) Trends by type of offense
a. Percent distribution by type of offense
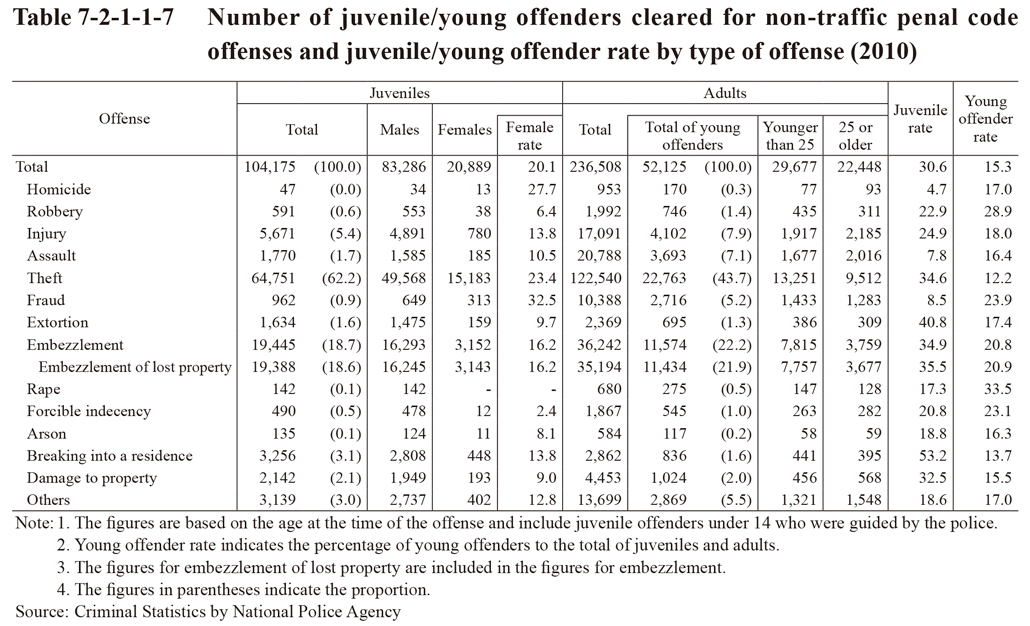
Table 7-2-1-1-7 shows the number of juveniles and young offenders cleared for non-traffic penal code offenses, and juvenile/young offender rate, by type of offense in 2010 (See Appendices 7-3, 7-4, and 7-5). By type of offense, theft accounted for the highest proportion with both juveniles and young offenders, followed by embezzlement of lost property (these two offenses accounted for 80.8% of all juveniles cleared and 65.6% of all young offenders cleared). In addition, the juvenile rate was high for breaking into a residence, extortion, embezzlement of lost property, theft, and damage to property while the young offender rate was high for rape, robbery, fraud, forcible indecency, and embezzlement of lost property.
Table 7-2-1-1-7 Number of juvenile/young offenders cleared for non-traffic penal code offenses and juvenile/young offender rate by type of offense (2010)
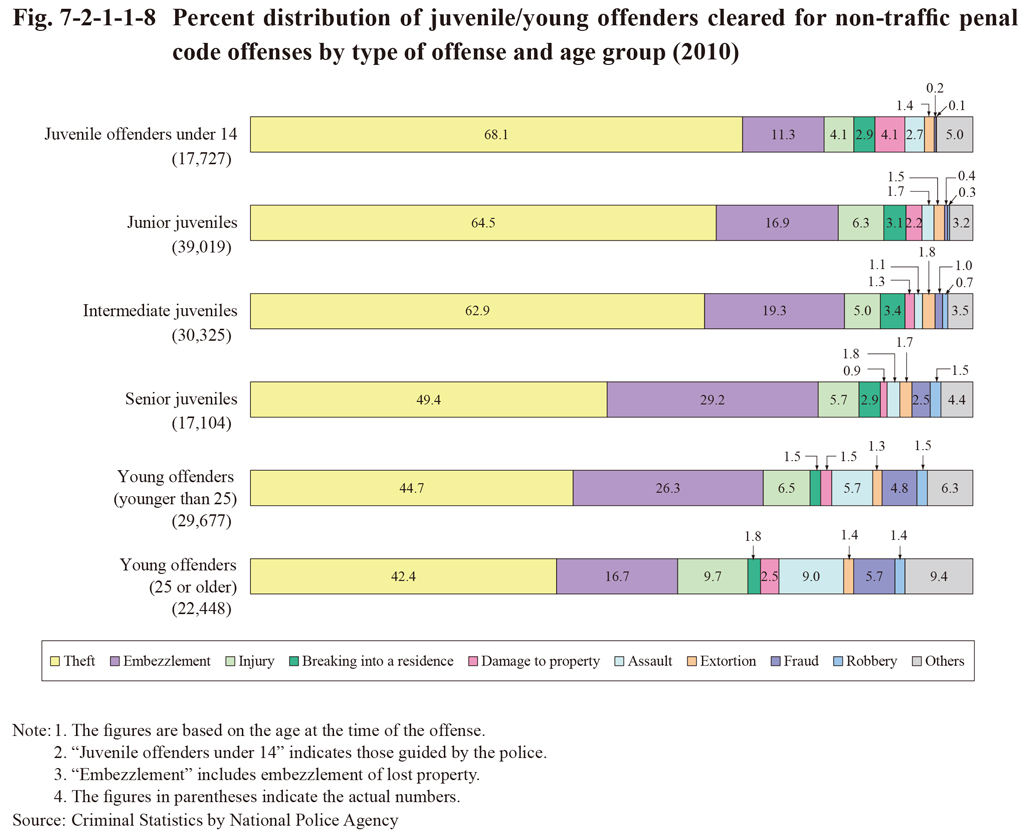
Next, Fig. 7-2-1-1-8 shows the percent distribution of juveniles and young offenders cleared for non-traffic penal code offenses, by type of offense and age group. Theft accounted for the highest proportion across all age groups, but with the proportion declining as the age of the group rose and the proportion of injury, assault, fraud, and “others” rising with groups of intermediate juveniles and older age groups, thus indicating the diversity of offenses.
Fig. 7-2-1-1-8 Percent distribution of juvenile/young offenders cleared for non-traffic penal code offenses by type of offense and age group (2010)
b. Rate per population
Fig. 7-2-1-1-9 shows the rate per population of juveniles and young offenders (younger than 25/25 or older) cleared for major non-traffic penal code offenses since 1989. The rate per population of those cleared for robbery, injury/assault, and theft was consistently high with juveniles when compared with other age groups. The rate of young offenders stand at the second, as the rate per population of those younger than 25 was generally higher than that of those aged 25 or older. With theft the rate per population of juveniles was then consistently much higher, even when compared to young people younger than 25. With fraud the rate per population of offenders younger than 25 was the highest over the last 10 years when compared with other age groups. In addition, the rate per population of young people (25 or older) for injury/assault, that of young people for theft, and that of juveniles and young people for fraud were increasing over the last 10 years.
Fig. 7-2-1-1-9 Rate per population of juvenile/young offenders cleared for major non-traffic penal code offenses (1989-2010)
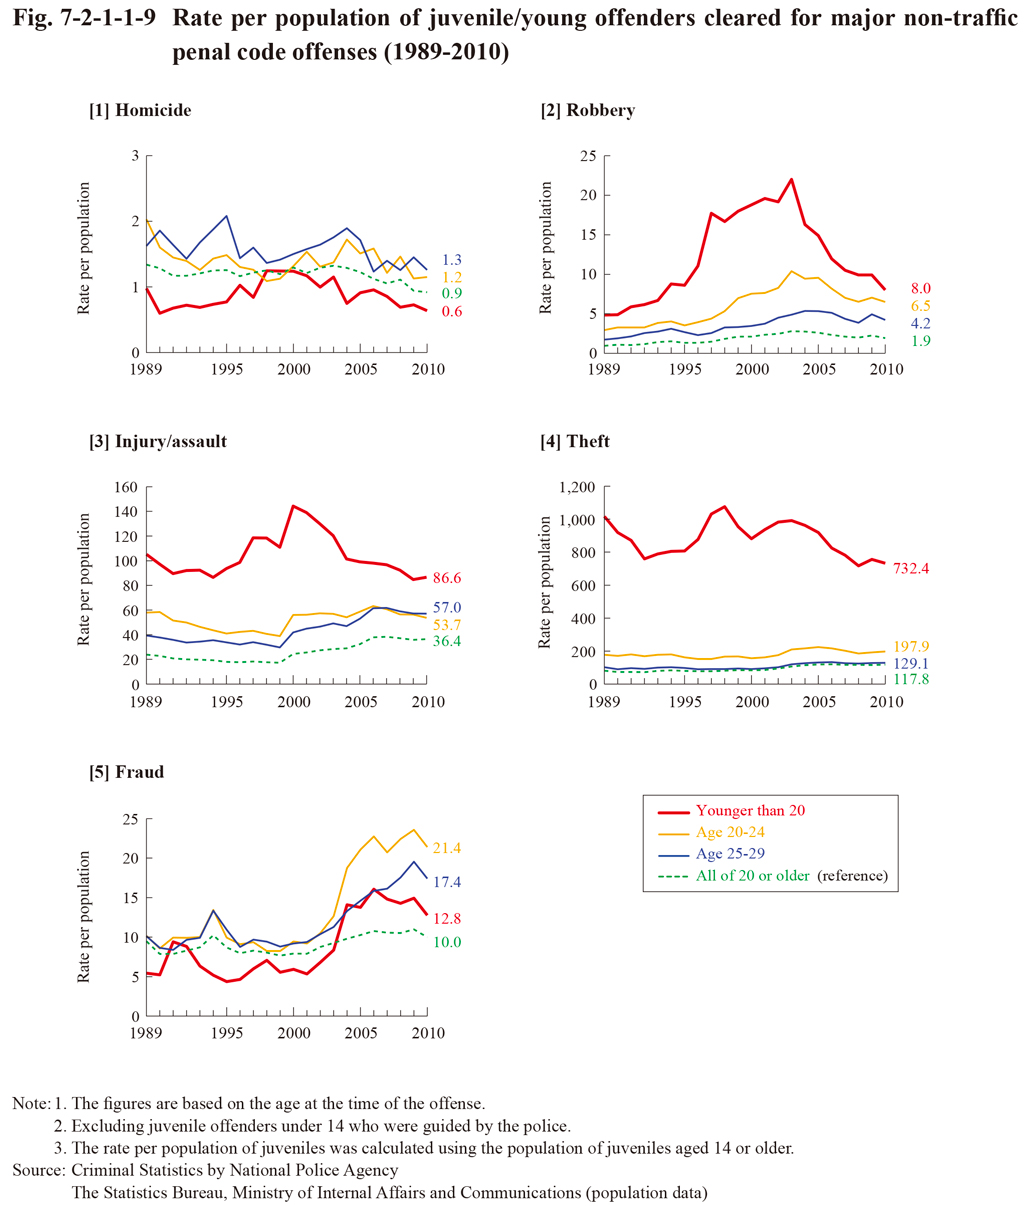
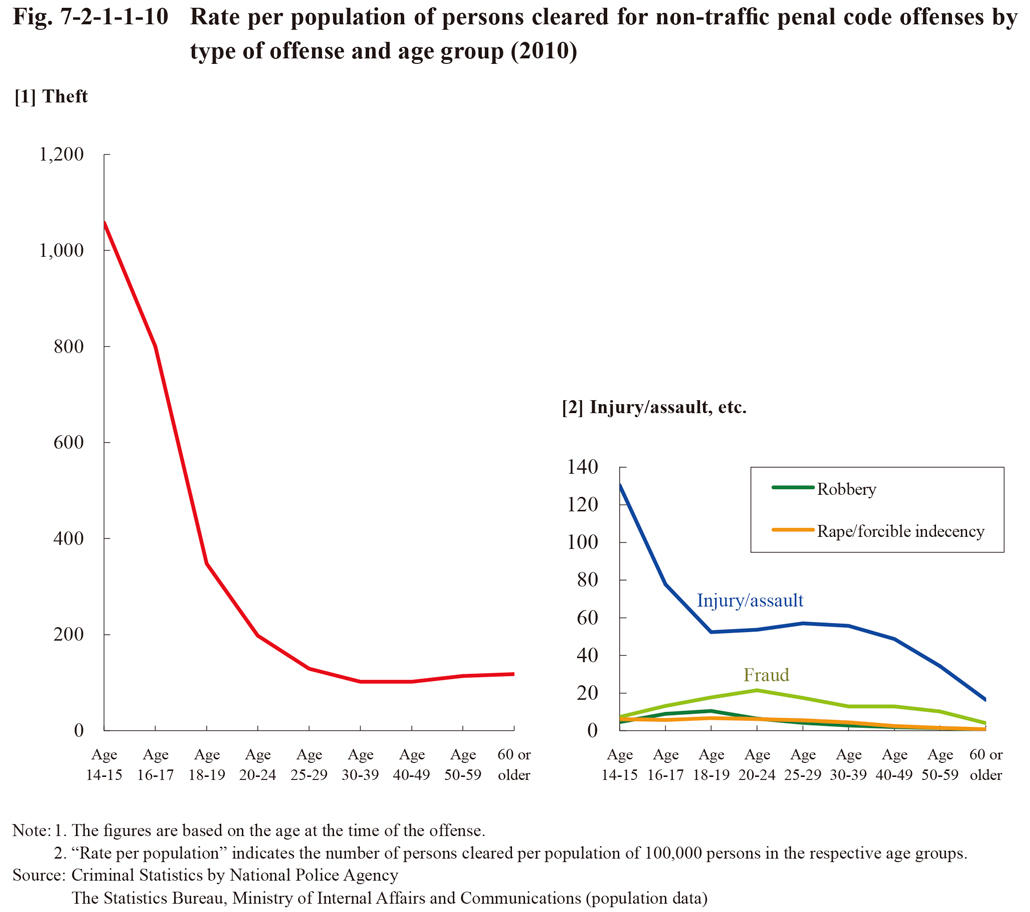
Fig. 7-2-1-1-10 shows the rate per population of persons cleared for a couple of non-traffic penal code offenses by age group in 2010. With theft the rate per population was extremely high when compared to other offenses. By age group, that of junior juveniles was remarkably high at 1057.8, that of senior juveniles declined significantly to 347.8, and that of young people even lower. The rate per population of junior juveniles with injury/assault was also high at 130.4 when compared to other age groups.
Fig. 7-2-1-1-10 Rate per population of persons cleared for non-traffic penal code offenses by type of offense and age group (2010)
c. Modus operandi of theft
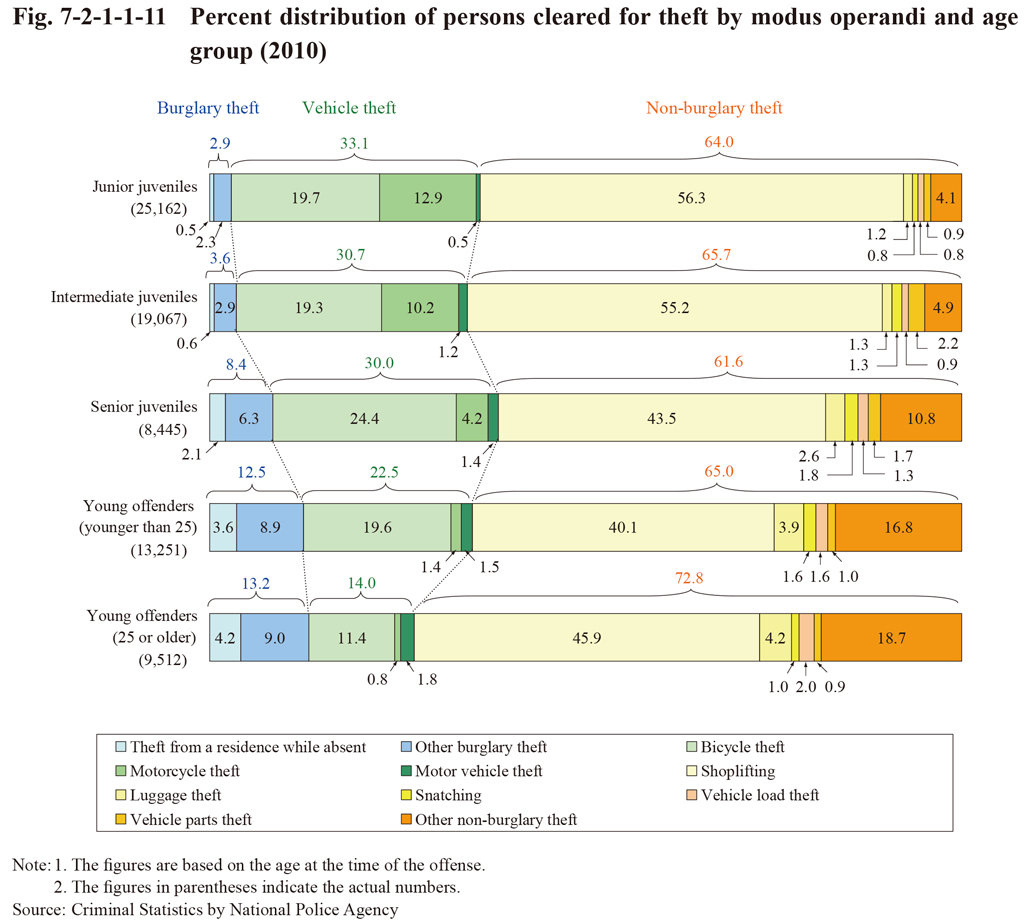
Fig. 7-2-1-1-11 shows the percent distribution of junior juveniles, intermediate juveniles, senior juveniles, and young offenders (younger than 25 / 25 or older) cleared for theft, by modus operandi, in 2010. With all age groups, the proportion of non-burglary theft stayed at high level with the proportion for shoplifting being particularly high. As the age of the group rose, however, the proportion of modus operandi other than shoplifting rose to result in a more diverse range of the modus operandi of theft. Furthermore, the proportion of burglary theft rose while that of vehicle theft (bicycle theft and motorcycle theft in particular) declined, thus indicating that the proportion of theft through malignant modus operandi was getting high.
Fig. 7-2-1-1-11 Percent distribution of persons cleared for theft by modus operandi and age group (2010)
(4) Complicity status
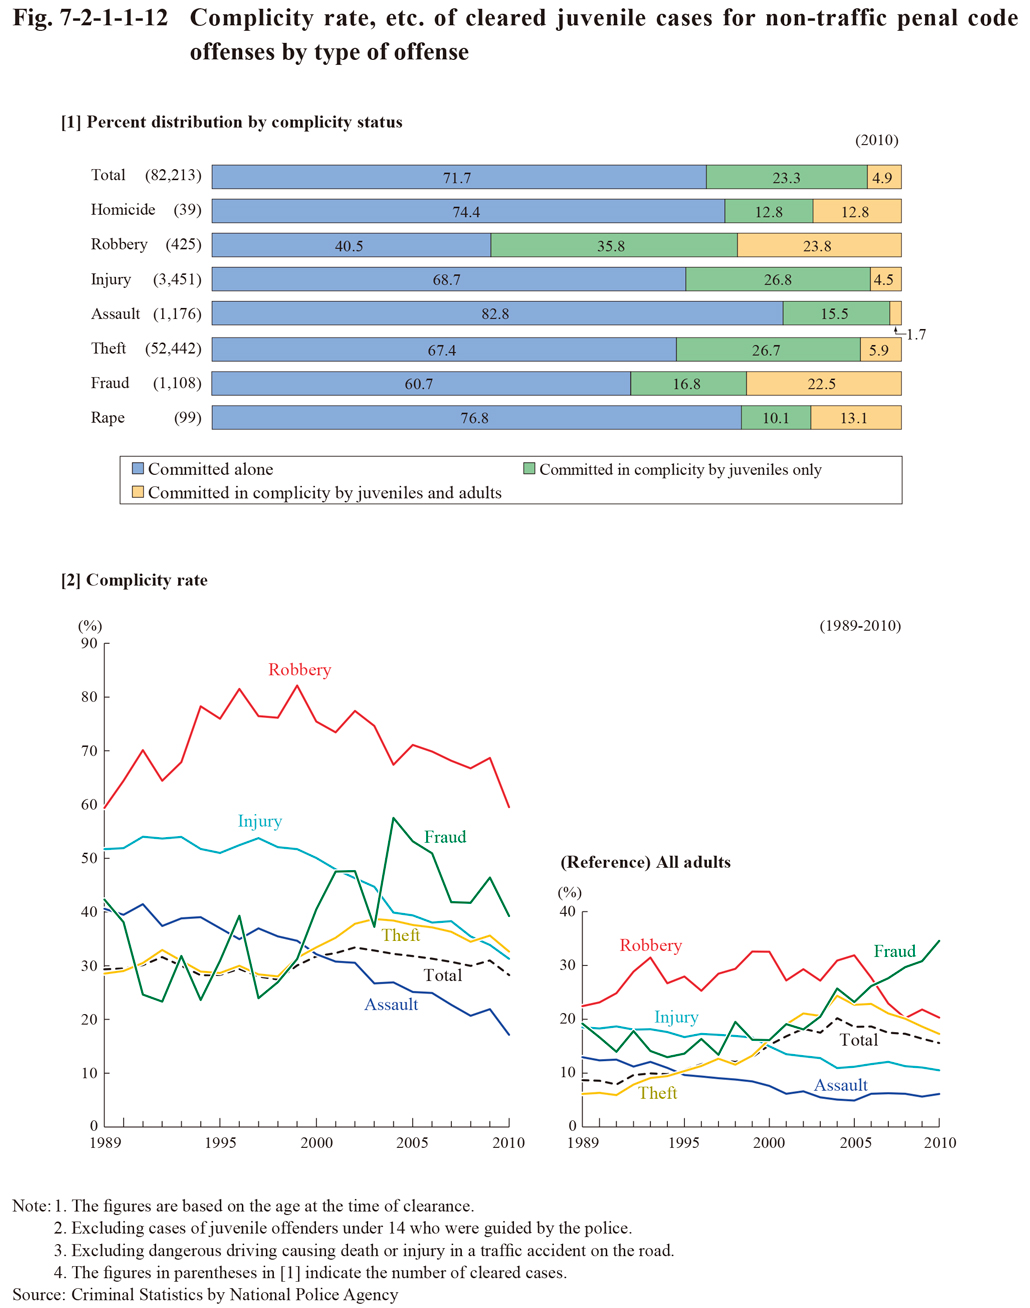
Fig. 7-2-1-1-12 [1] shows the status of cleared juvenile cases involving complicity (excluding cases where the result of an investigation confirmed that the act in question did not constitute a crime or that prerequisite for prosecution or punishment had not met) for major non-traffic penal code offenses (excluding dangerous driving causing death or injury in a traffic accident on the road) in 2010 and Fig. 7-2-1-1-12 [2] the rate of cleared juvenile cases involving complicity (percentage of cases committed in complicity (including cases committed in complicity by juveniles and adults) to total cleared cases) for major offenses since 1989. Examining the complicity rate by type of offense in 2010 revealed that robbery (59.5%), fraud (39.3%), and theft (32.6%) accounted for the highest rates and, especially, the proportion of cases committed in complicity by juveniles and adults was high for robbery and fraud, when compared to other offenses, thus indicating the prevalence of cases being committed via the influence of adults. Change in the complicity rate of juveniles indicated that the complicity rate for robbery went through some ups and downs but remained at the high level of generally within the range of 60 to 80%. That for injury and assault was decreasing and was 31.3% (51.7% in 1989) and 17.2% (40.6% (id.)) in 2010, respectively.
Fig. 7-2-1-1-12 Complicity rate, etc. of cleared juvenile cases for non-traffic penal code offenses by type of offense