Section 4 Treatment at Juvenile Training Schools
1 Juveniles newly admitted to juvenile training schools
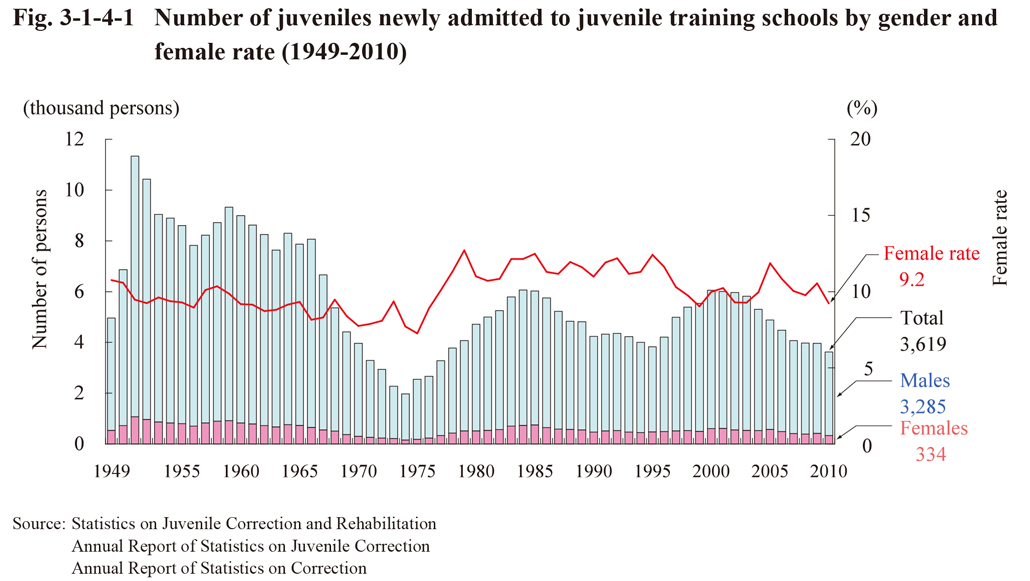
(1) Number of juveniles newly admitted to juvenile training schools
Fig. 3-1-4-1 shows the number of juveniles newly admitted to juvenile training schools by gender since 1949. The number has fluctuated after having reached a post WWII low level in 1974 at 1969. During the last 20 years the number reached a peak of 6,052 in 2000, but then continued to decrease (See Appendix 3-5).
Fig. 3-1-4-1 Number of juveniles newly admitted to juvenile training schools by gender and female rate (1949-2010)
(2) Characteristics of juveniles newly admitted to juvenile training schools
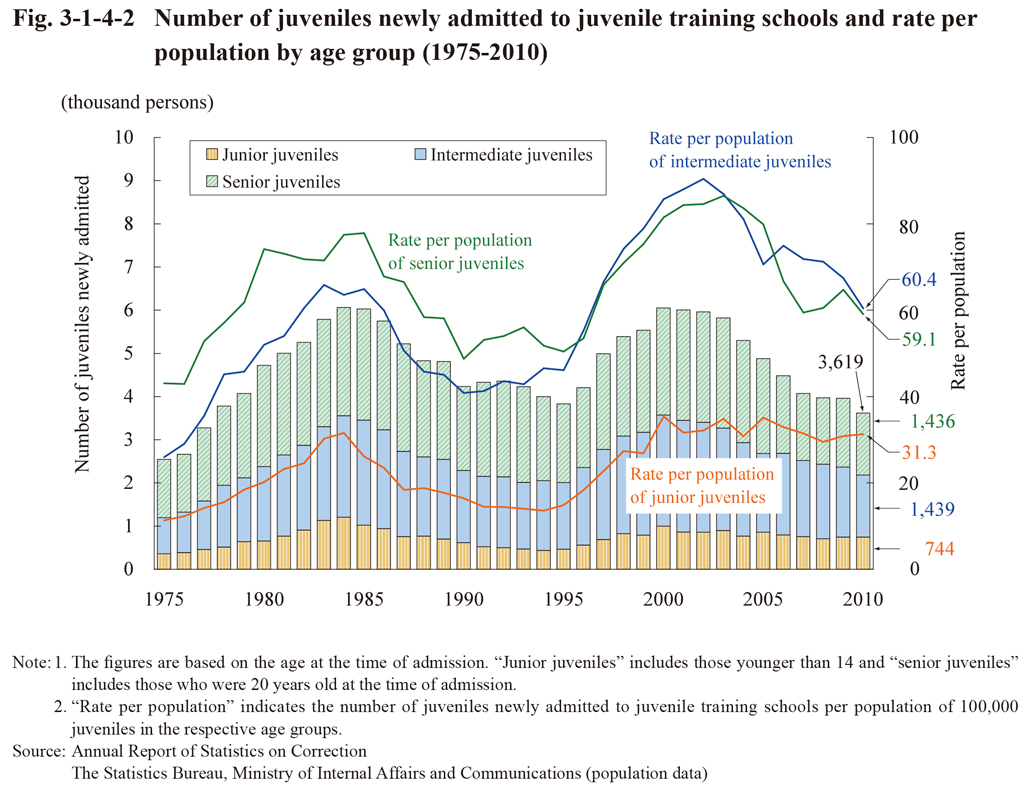
a. Age
Fig. 3-1-4-2 shows the number of juveniles newly admitted to juvenile training schools and rate per population by age group since 1975.
The number was generally on a decreasing trend across all age groups over the last 10 years, with 1,439 (down 181 from the previous year) intermediate juveniles and 1,436 (down 162 (id.)) senior juveniles in 2010. The number of junior juveniles did turn to an increasing trend in 2009, and was the same as the previous year at 744 in 2010.
Comparing the rate per population of the number of juveniles of the respective age groups newly admitted to juvenile training schools in 2010 with that in 1978 (the number of juveniles newly admitted to juvenile training schools being 3,779) and then that in 1995 (3,828 (id.)), when the number of juveniles reached basically the same level as in 2010 on and after 1975, revealed that the rate per population was higher across all ages in 2010 (that in 1978, 1995, and 2010 of junior juveniles being 15.5, 14.9, 31.3, intermediate juveniles 45.1, 46.1, 60.4, and senior juveniles 57.1, 50.4, 59.1, respectively).
12 male juveniles and one female juvenile younger than 14 were newly admitted to juvenile training schools in 2010.
Fig. 3-1-4-2 Number of juveniles newly admitted to juvenile training schools and rate per population by age group (1975-2010)
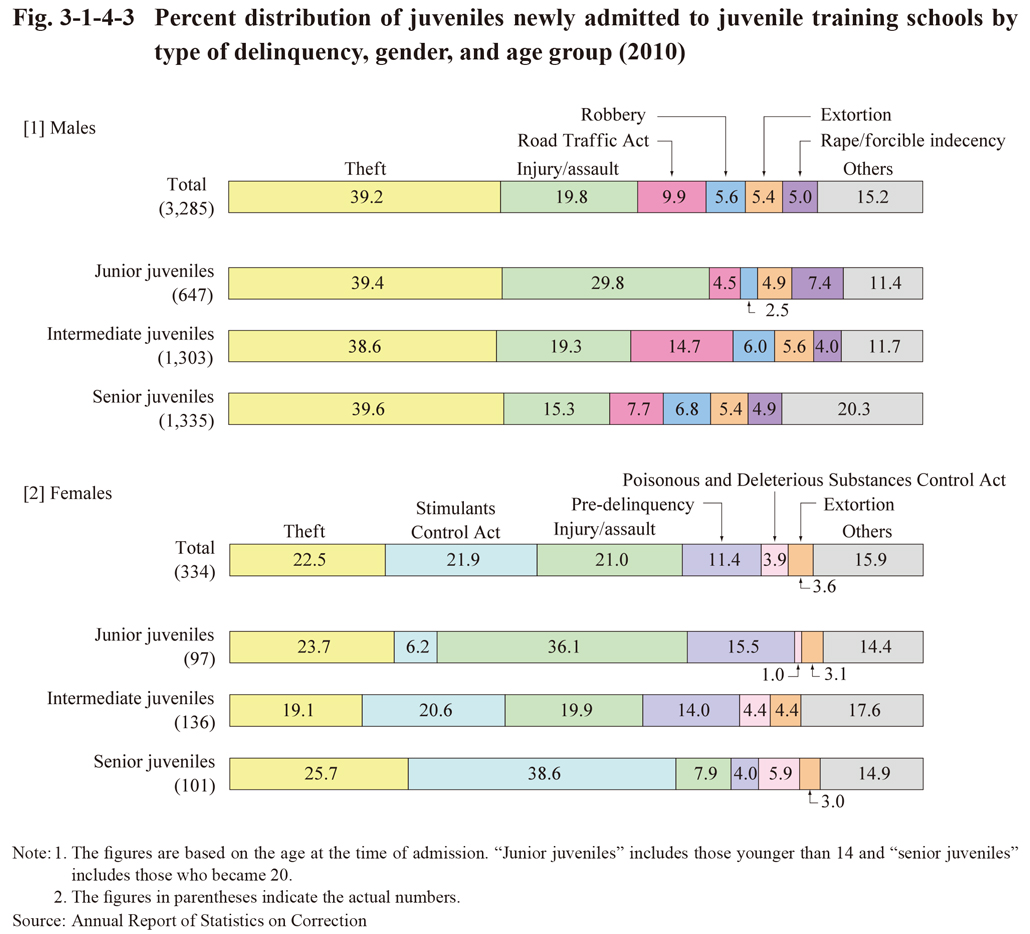
b. Type of delinquency
Fig. 3-1-4-3 shows the percent distribution of juveniles newly admitted to juvenile training schools by the type of delinquency, gender, and age group in 2010. The proportion of theft was the highest with both males and females. With females, however, the proportion was lower for theft when compared to males but high for Stimulants Control Act violations (21.9%) and pre-delinquency (11.4%). In addition, as the age of the group rose, the proportion for injury/assault declined with males, whereas those for pre-delinquency and injury/assault declined, but Stimulants Control Act violations significantly rose with females (See Appendix 3-6).
Fig. 3-1-4-3 Percent distribution of juveniles newly admitted to juvenile training schools by type of delinquency, gender, and age group (2010)
c. Educational level and educational/employment status
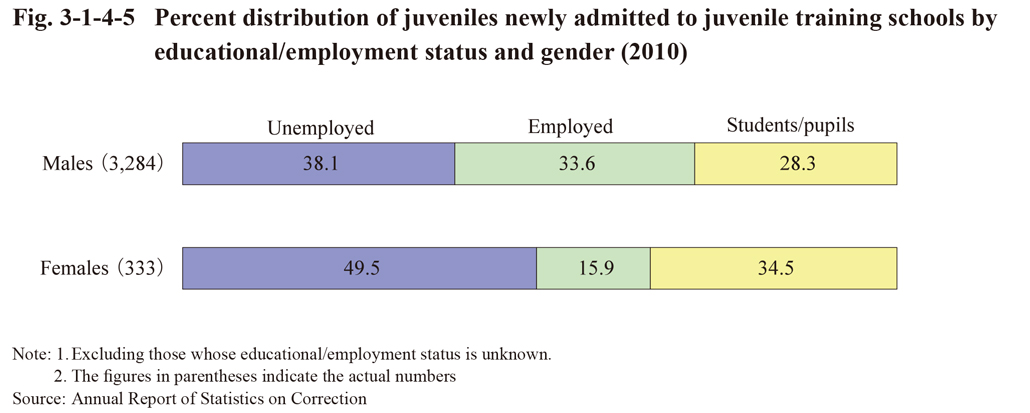
Fig. 3-1-4-4 shows the percent distribution of juveniles newly admitted to juvenile training schools in 2010 by their educational level and gender, while Fig. 3-1-4-5 shows the same by their educational/employment status and gender. By educational level, the proportion of junior high school graduates and senior high school dropouts was high with both males and females. By educational/employment status, the proportion of unemployed and students/pupils was higher with females than males.
Fig. 3-1-4-4 Percent distribution of juveniles newly admitted to juvenile training schools by educational level and gender (2010)
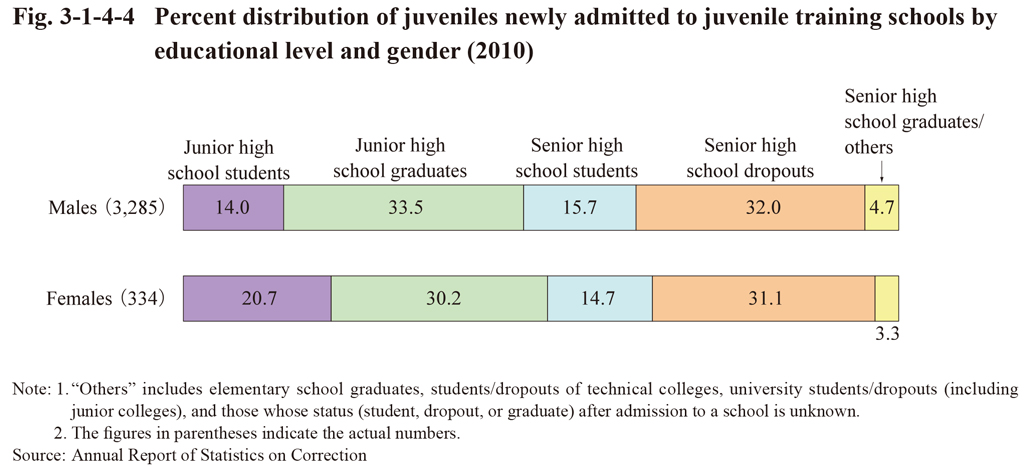
Fig. 3-1-4-5 Percent distribution of juveniles newly admitted to juvenile training schools by educational/employment status and gender (2010)
d. Association with delinquent groups
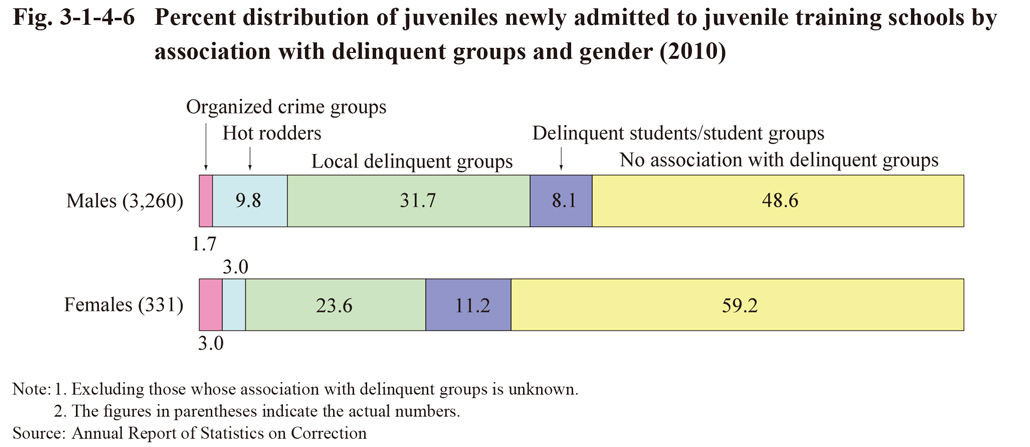
Fig. 3-1-4-6 shows the percent distribution of juveniles newly admitted to juvenile training schools by association with delinquent groups and gender in 2010. The percentage of juveniles newly admitted to juvenile training schools that had associated with delinquent groups was approximately 50%, of which the proportion of those associated with local delinquent groups was the highest with both males and females. The proportion of those associated with hot rodders was higher with males than females.
Fig. 3-1-4-6 Percent distribution of juveniles newly admitted to juvenile training schools by association with delinquent groups and gender (2010)
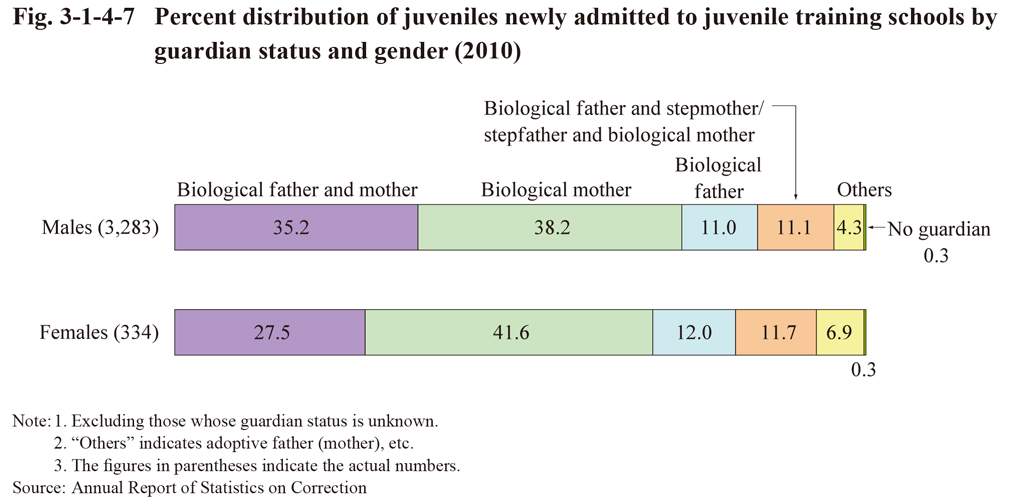
e. Status of guardians
Fig. 3-1-4-7 shows the percent distribution of juveniles newly admitted to juvenile training schools by their guardian status and gender in 2010. The proportion of those whose guardians were their biological mothers was on a rising trend over recent years, whereas the proportion of those whose guardians included both their biological fathers and mothers was on a declining trend, and was 16.3 points lower in 2010 than in 2000 (Source: Annual Report of Statistics on Correction).
Fig. 3-1-4-7 Percent distribution of juveniles newly admitted to juvenile training schools by guardian status and gender (2010)