3 Rate of served terms of imprisonment
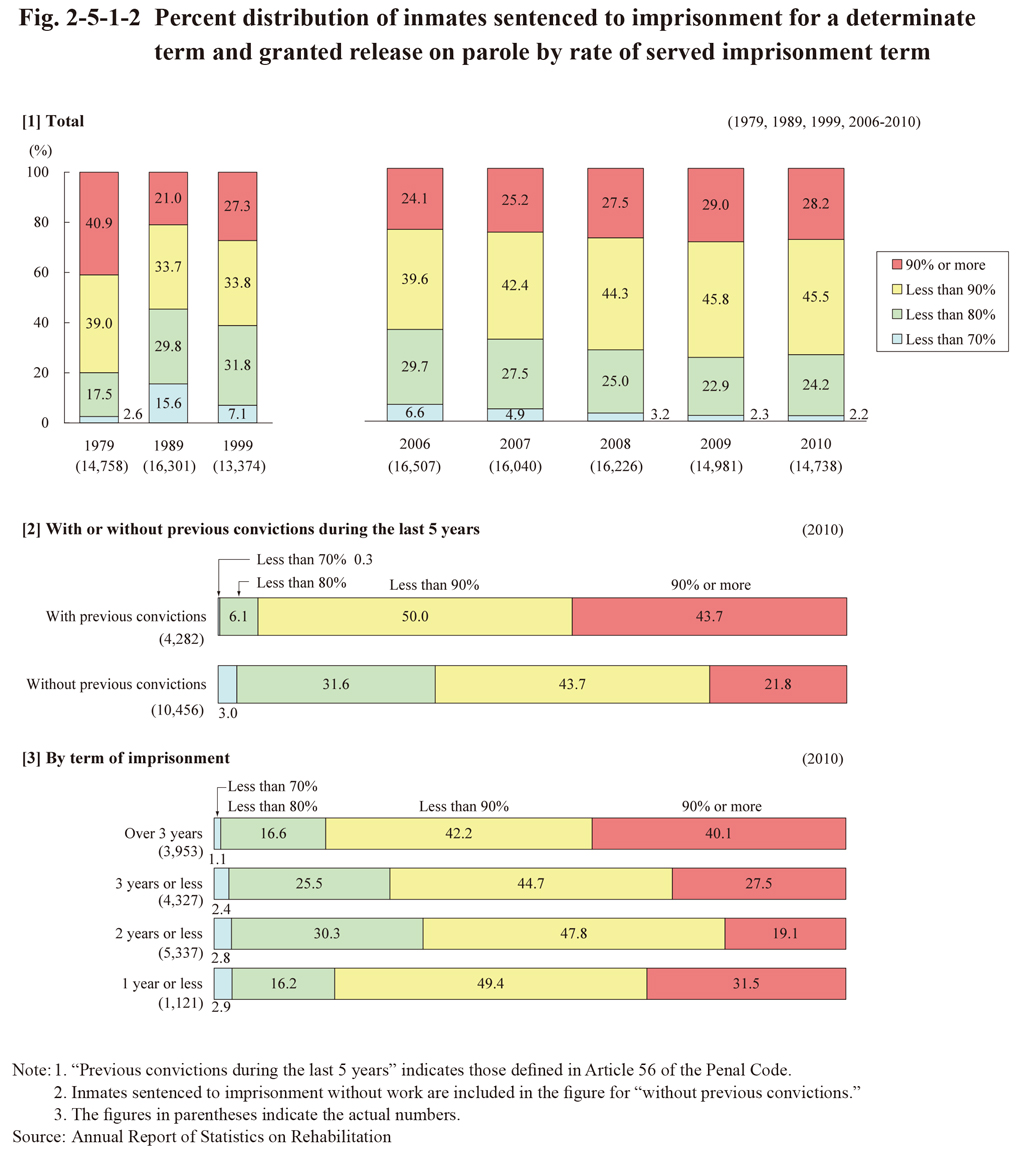
Fig. 2-5-1-2 shows the percent distribution of inmates sentenced to imprisonment for a determinate term and granted release on parole in 1979, 1989, 1999, and 2006-2010 by the rate of served terms of imprisonment (percentage of served term of imprisonment until release to the term of sentence). It also shows the percent distribution of those granted parole in 2010 by the rate of served terms of imprisonment, both with and without previous convictions during the last 5 years, and by term of sentence. In recent years the proportion of those granted parole at an early stage when the rate of the served term of imprisonment was still low was on a declining trend. In addition, this proportion was lower with those with previous convictions during the last 5 years than those without them, and lower as the term of imprisonment increased of those sentenced to imprisonment for a term of more than one year.
Fig. 2-5-1-2 Percent distribution of inmates sentenced to imprisonment for a determinate term and granted release on parole by rate of served imprisonment term