| Previous Next Index Image Index Year Selection | |
|
|
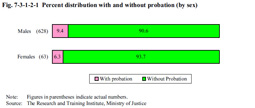
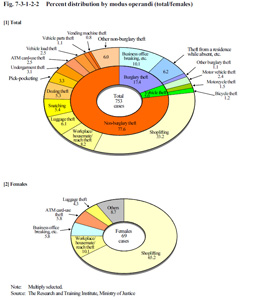
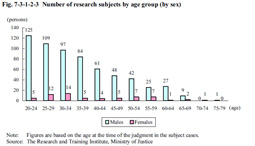
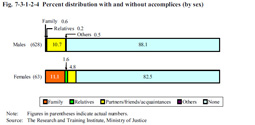
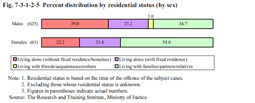
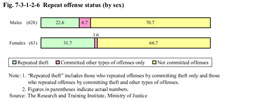
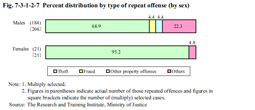
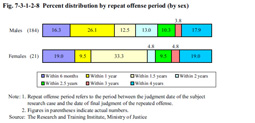
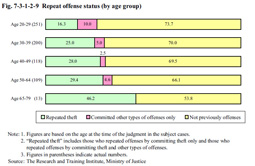
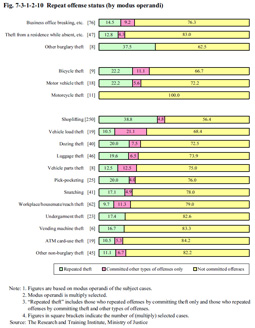
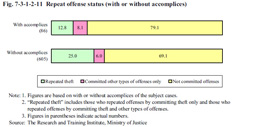
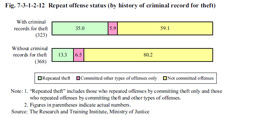
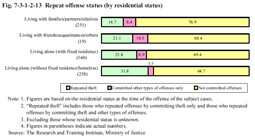
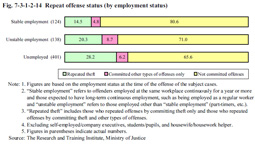
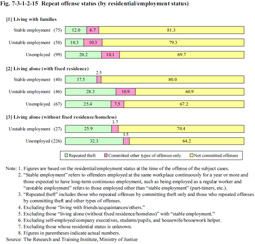
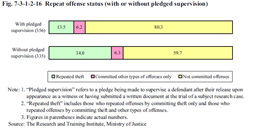
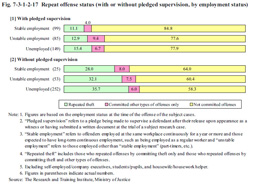
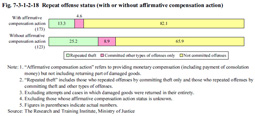
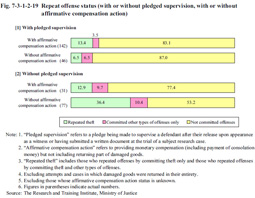
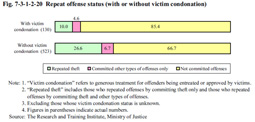
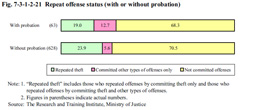
2 Theft (1) Overview of subject research cases and research subjects691 theft offenders, consisting of 90.9% males and 9.1% females, were selected as research subjects, as described earlier. With regard to sentencing at the time of the first suspension of execution of the sentence the terms of imprisonment of one year and one year and six months accounted for the major share with 281 persons (40.7%) and 274 persons (39.7%) respectively. A period of suspension of execution of the sentence of three years was dominantly high with 518 persons (75.0%), followed by four years with 151 persons (21.9%). Fig. 7-3-1-2-1 shows the percent distribution of research subjects both with and without probation. Persons who were placed under probation accounted for 9.1% overall (63 persons). The percentage of those who were placed under probation was slightly higher for males. Fig. 7-3-1-2-1 Percent distribution with and without probation (by sex) Fig. 7-3-1-2-2 shows the percent distribution of theft cases by modus operandi.Non-burglary theft accounted 77.6%, of which shoplifting was the highest at 33.2%. Among females, non-burglary theft accounted for the majority, with the proportion of shoplifting cases being particularly high (65.2%). Fig. 7-3-1-2-2 Percent distribution by modus operandi (total/females) Fig. 7-3-1-2-3 shows the number of research subjects by age group (at the time of the judgment in the subject research cases; hereinafter the same in this section).For males the number of those aged 20 to 24 was the highest, with the number then decreasing as the age of the group rose. Females had a slightly different trend as the number of those aged 25 to 34 was the highest. Fig. 7-3-1-2-3 Number of research subjects by age group (by sex) Fig. 7-3-1-2-4 shows the percent distribution of research subjects with and without accomplices.For both males and females, the proportion of those “without accomplices” was the highest. Among females, however, the proportion of those “with accomplices” was higher than males, with the proportion of those with “family” as accomplices being particularly high. Fig. 7-3-1-2-4 Percent distribution with and without accomplices (by sex) Fig. 7-3-1-2-5 shows the percent distribution of research subjects by residential status (at the time of the offense of the subject research cases; hereinafter the same in this section).For males the proportion of those living alone was over 60%, and the proportion of those without fixed residence/homeless particularly high at nearly 40%. Over half of all females were living with their families/partners/relatives. Fig. 7-3-1-2-5 Percent distribution by residential status (by sex) (2) Repeat offense statusThe attributes and circumstances of the offenses, etc. committed by the research subjects, both repeat and single offenders, will be compared and discussed below. a. Overall status First, Fig. 7-3-1-2-6 shows the repeat offense status of all the research subject theft offenders. The number of persons who repeated theft (including those who repeated offenses by committing theft only and those who repeated offenses by committing theft and other types of offenses; hereinafter the same in this subsection) was 162 persons (23.4%) while the number of those who committed other types of offenses only was 43 persons (6.2%). The repeat offense rate for theft was higher for females than for males. The reason for this can be considered to be that shoplifting, for which the repeat offense rate for theft was high (See Fig. 7-3-1-2-10), accounted for the majority of offenses by females. Fig. 7-3-1-2-6 Repeat offense status (by sex) Fig. 7-3-1-2-7 and Fig. 7-3-1-2-8 show the type of offense and the repeat offense period (refers to the period between the judgment of the subject research case and the date of final judgment of the repeated offense; hereinafter the same in this section) among those who repeated offenses, divided by sex.With regard to the type of offense, theft was the repeated offense for the majority of repeat offenders. In particular, all except one of the 21 female repeat offenders had committed theft as the repeated offense. Examining the repeat offense period reveals that the majority of those who repeated offenses did so within one and a half years and were convicted in a final judgment. The repeat offense period tended to be shorter than that for stimulants offenders (See Fig. 7-3-1-3-6). Fig. 7-3-1-2-7 Percent distribution by type of repeat offense (by sex) Fig. 7-3-1-2-8 Percent distribution by repeat offense period (by sex) b. Analysis of repeat offense status under various conditionsFig. 7-3-1-2-9 shows repeat offense rates by age group. The repeat offense rate for theft increased as the age of the group rose. It can be observed that the percentage of those difficult to rehabilitate increases as the age at which suspension of execution of the sentence was granted rises. For elderly offenders aged 65 or older, the type of the offense repeated was theft in all cases. Fig. 7-3-1-2-9 Repeat offense status (by age group) Fig. 7-3-1-2-10 shows repeat offense status by modus operandi among the subject research cases.The repeat offense rate was high for shoplifting and most of the repeated offenses were theft. Fig. 7-3-1-2-10 Repeat offense status (by modus operandi) Fig. 7-3-1-2-11 shows repeat offense status both with and without accomplices for the subject research cases.The repeat offense rate for theft by those “without accomplices” is higher than those “with accomplices.” Fig. 7-3-1-2-11 Repeat offense status (with or without accomplices) Fig. 7-3-1-2-12 shows repeat offense status by history of criminal record for theft.The repeat offense rate for theft by those with criminal records for theft was remarkably high when compared to those without such records. Fig. 7-3-1-2-12 Repeat offense status (by history of criminal record for theft) Fig. 7-3-1-2-13 shows repeat offense status by residential status.The repeat offense rate for theft was high among those “living alone (without fixed residence/homeless),” those “living alone (with fixed residence),” those “living with friends/acquaintances/others,” and those “living with families/partners/relatives,” in that order. Although the order of those “living alone (with fixed residence)” and those “living with friends/acquaintances/others” was reversed for the repeat offense rate including types of repeated offense other than theft, it can be observed that the repeat offense rate, especially the repeat offense rate for theft, tended to be higher as residential status became less stable. Fig. 7-3-1-2-13 Repeat offense status (by residential status) Fig. 7-3-1-2-14 shows repeat offense status by employment status (at the time of the offense of the subject research cases; hereinafter the same in this section).Among employed persons, those employed at the same workplace continuously for a year or more and those who are expected to have long-term continuous employment, such as being employed as a regular worker, are placed under the “stable employment” category, while others (part-timers, etc.) are categorized under “unstable employment” (hereinafter the same in this section). The repeat offense rate was the highest among persons “unemployed” and the lowest among those with “stable employment,” indicating that the repeat offense rate increased as employment status became less stable. Fig. 7-3-1-2-14 Repeat offense status (by employment status) Furthermore, residential status and employment status were examined in combination in order to analyze how these factors function in the context of repeat offences. Fig. 7-3-1-2-15 shows repeat offense status by residential/employment status (persons “living with friends/acquaintances/others” and “living alone (without fixed residence/homeless)” who have “stable employment” were excluded as the numbers involved were quite small).An examination of cases of persons “living with families” and those “living alone (with fixed residence)” clearly reveals the repeat offense rate to be high for those “unemployed” when compared to those with “stable employment” in both cases. It should be noted, however, that the tendency of persons with “unstable employment” in the case of “living with families” to repeat offenses is similar to those with “stable employment,” while that in the case of “living alone (with fixed residence)” is similar to those “unemployed.” That is to say, although “unstable employment” generally increases the possibility of repeat offenses when compared to “stable employment,” it also suggests that the risk of a repeating offense is quite small in the case of “living with families.” In addition, although “unstable employment” could be an overall factor in lowering the possibility of repeat offenses when compared to being “unemployed,” this is not necessarily true for anyone “living alone (with fixed residence).” The same can also be said for anyone with an unstable residential status (without fixed residence/homeless). Fig. 7-3-1-2-15 Repeat offense status (by residential/employment status) Fig. 7-3-1-2-16 shows repeat offense status both with and without pledged supervision (refers to a pledge being made to supervise a defendant after their release upon appearance as a witness or having submitted a written document at the trial of a subject research case; hereinafter the same in this section).Basically half of all theft offenders were “with pledged supervision,” and half “without pledged supervision.” The repeat offense rate for theft was remarkably low for persons “with pledged supervision” when compared to those “without pledged supervision.” Fig. 7-3-1-2-16 Repeat offense status (with or without pledged supervision) Furthermore, pledged supervision and employment status were examined in combination in order to analyze how these factors function in the context of repeat offenses. Fig. 7-3-1-2-17 shows repeat offense status both with and without pledged supervision and by employment status.The repeat offence rate was considerably higher for those “without pledged supervision” when compared with those “with pledged supervision,” regardless of employment status. In particular, the repeat offence rate for theft by those “without pledged supervision,” even with “stable employment,” was twice as high as that of persons “with pledged supervision” who were “unemployed.” This indicates that the existence of someone to pledge supervision serves as a deterrent to repeat offenses. Fig. 7-3-1-2-17 Repeat offense status (with or without pledged supervision, by employment status) Fig. 7-3-1-2-18 shows repeat offense status in consummated theft cases (cases in which damaged goods were returned in their entirety were excluded because compensation was not necessarily an issue in those cases) both with and without affirmative compensation action (refers to providing monetary compensation (including payment of consolation money) but not including returning part of damaged goods; hereinafter the same in this subsection).The repeat offense rate of persons who had taken affirmative compensation action was remarkably low when compared with those who had not. Fig. 7-3-1-2-18 Repeat offense status (with or without affirmative compensation action) Furthermore, since affirmative compensation action may in many cases be taken on behalf of offenders by persons who have pledged to supervise offenders, pledged supervision may not necessarily be an independent factor in repeat offences. These factors are combined in Fig. 7-3-1-2-19, which shows repeat offense status both with and without pledged supervision and with and without affirmative compensation action.Nearly half of those with neither pledged supervision nor affirmative compensation action repeated offences, while the repeat offence rate in the other cases was significantly low. It is notable that no significant difference in the repeat offense rate exists between the cases with affirmative compensation action but no pledged supervision and the cases with pledged supervision. That is to say, although the repeat offence rate of cases without pledged supervision tended to be high overall, the possibility of repeat offences significantly decreased if offenders had made the efforts to take affirmative compensation action. This is considered attributable to the offenders’ willingness to be rehabilitated. Fig. 7-3-1-2-19 Repeat offense status (with or without pledged supervision, with or without affirmative compensation action) Fig. 7-3-1-2-20 shows repeat offense status both with and without victim condonation.The repeat offense rate of cases with victim condonation (refers to cases in which victims entreated for or approved generous treatment for offenders; hereinafter the same in this subsection) was remarkably low, being less than half of that of cases without victim condonation. In many cases victim condonation resulted from efforts made by the offenders and those who pledged to supervise them (affirmative compensation actions are thought to be more likely to be taken in cases in which such efforts had been made; in actuality, affirmative compensation actions had been taken in most of the 130 cases in which victim condonation occurred). Victim condonation can therefore be considered as illustrative of how the risk of repeating offences can be lowered through such efforts. Fig. 7-3-1-2-20 Repeat offense status (with or without victim condonation) Lastly, Fig. 7-3-1-2-21 shows repeat offense status both with and without probation.The repeat offense rate for theft was low among those placed under probation when compared to those who were not. When persons who had committed any type of repeat offense other than theft were included, the repeat offense rate of persons “with probation” proved slightly higher. However, since probation was granted to persons whose rehabilitation conditions, such as family environment and living situation, etc. was poor to begin with, and thus who had a relatively high risk of repeat offenses, the fact that the repeat offense rate of persons “with probation” remained at almost the same level as those “without probation” could be considered as proof of the effectiveness of probation in reformation/rehabilitation and thus also in preventing repeat offenses. In addition, in regard to persons “living alone (without fixed residence/homeless),” “unemployed,” and “without pledged supervision” whose repeat offense rate was generally high, the repeat offense rate of those “with probation” and that of those “without probation” are compared below. Among persons “living alone (without fixed residence/homeless)” (258 persons): For those “with probation” (20 persons) the repeat offence rate was 25.0% For those “without probation” (238 persons) the repeat offence rate was 36.1% Among persons “unemployed” (401 persons): For those “with probation” (38 persons) the repeat offence rate was 23.7% For those “without probation” (363 persons) the repeat offence rate was 35.5% Among persons “without pledged supervision” (335 persons): For those “with probation” (34 persons) the repeat offence rate was 32.4% For those “without probation” (301 persons) the repeat offence rate was 41.2% In all the above cases the repeat offense rate of persons “with probation” was lower, thus indicating that probation is effective in reformation/rehabilitation and thus also in preventing repeat offenses. Meanwhile, since suspension of execution of the sentence may only be revoked after being convicted by a final judgment for a repeat offense during the period of suspension of execution of the sentence, it may not be revoked in the case of a repeat offense. The suspended execution revocation rate for a repeat offense was 28.6% of those placed under probation and 22.5% of those not placed under probation. The reason for this is that the proportion of persons for whom the period of suspension of execution of the sentence was short (three years or less) was high at 81.1% among those not placed under probation (33.3% among those placed under probation), with about 30% of those falling into this category not having had their probation revoked in spite of having repeated offenses. Fig. 7-3-1-2-21 Repeat offense status (with or without probation) (3) ConclusionAbout 30% of research subject theft offenders repeated offenses, with about 80% of the repeat offenses being for theft. The majority of cases involving female offenders were for non-burglary theft, and mainly shoplifting. The high tendency to repeat shoplifting resulted in a higher repeat offense rate for females than males. In addition, most of the repeat offense cases involved repeating theft. The risk of repeat offenses decreased as residential/employment status became more stable. The significance of employment status as a repeat offense factor varies with the different residential status. It can be observed that being employed was not a particularly effective in preventing repeat offenses among those living alone unless they had stable employment. In addition, it can be observed that the existence of someone to pledge to supervise an offender can be a significant preventive factor against repeat offenses, and that the repeat offense rate tended to be remarkably low when affirmative compensation measures had been taken through the efforts of offenders or anyone who had pledged to supervise them. Although the number of persons who were placed under probation was less than 10%, probation was observed to be quite effective in preventing repeat offenses. |
