| Previous Next Index Image Index Year Selection | |
|
|
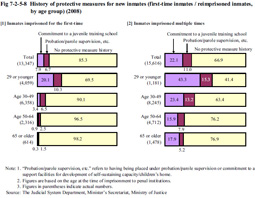
5 History of protective measures of inmates Fig. 7-2-5-8 shows the percent distribution of new inmates by history of protective measures, imprisonment record and age group in 2008.The percentage of persons with histories of protective measures (refers to those who had previously been placed under protective measures) increased as the age of the group declined. In addition, the percentage of those with histories of protective measures was remarkably high as for those imprisoned multiple times when compared to those imprisoned for the first-time across every age group. Fig 7-2-5-8 History of protective measures for new inmates (first-time inmates / reimprisoned inmates, by age group) (2008) |
