| Previous Next Index Image Index Year Selection | |
|
|
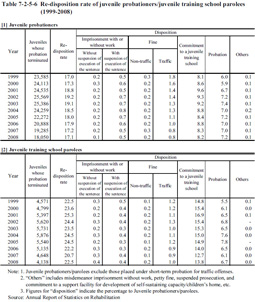
4 Re-disposition, etc. of juvenile probationers/juvenile training school parolees Table 7-2-5-6 shows the percentage of juvenile probationers and juvenile training school parolees (limited to those who had their probation/parole supervision terminated in the respective year) who were placed under new protective measures or received criminal dispositions due to repeat offenses or delinquencies during the probation/parole supervision period (hereinafter referred to as the “re-disposition rate” in this subsection) over the last 10 years.The percentage was 17.0 to 19.2% of juvenile probationers and 20.7 to 25.3% of juvenile training school parolees. Table 7-2-5-6 Re-disposition rate of juvenile probationers/juvenile training school parolees (1999–2008)
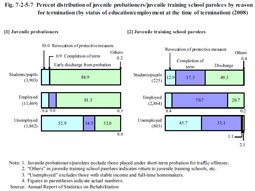
The rate of probation/parole revocation (refers to revocation of the former measures being placed under new measures due to repeat delinquencies/offenses) among juveniles who were unemployed at the time of termination of their probation/parole supervision was remarkably high at 52.9% for juvenile probationers and 45.7% for juvenile school parolees when compared to those who were employed. Fig. 7-2-5-7 Percent distribution of juvenile probationers/juvenile training school parolees by reason for termination (by status of education/employment at the time of termination) (2008)
|