| Previous Next Index Image Index Year Selection | |
|
|
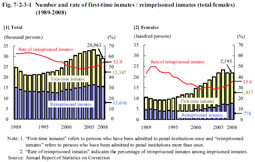
1 Reimprisoned inmates (1) Reimprisoned inmates and their rateFig. 7-2-3-1 shows the number of first-time inmates (refers to those who had been admitted to penal institutions once; hereinafter the same in this subsection) / reimprisoned inmates (refers to those who had been admitted to penal institutions more than once; hereinafter the same in this subsection) and the rate of reimprisoned inmates (refers to the percentage of reimprisoned inmates among all inmates; hereinafter the same in this subsection) over the last 20 years. The number of reimprisoned inmates had been on a decreasing trend until 1998, but then turned to an increasing trend, being 15,616 in 2008. The rate of reimprisoned inmates remained in the range of 48 to 63% but then continued to increase every year from 2004, and was 53.9% in 2008. For females, the number of reimprisoned inmates showed a similar trend, and was 778 in 2008. In addition, the rate of reimprisoned female inmates remained at the relatively low level of between 28 and 50%, but then continued to increase every year from 2005, reaching 35.4% in 2008. Fig. 7-2-3-1 Number and rate of first-time inmates / reimprisoned inmates (total/females) (1989–2008)
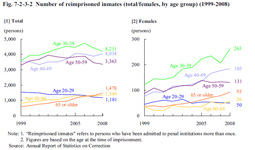
Fig. 7-2-3-2 shows the number of reimprisoned inmates by age group over the last 10 years. The number of those aged 30 to 39 was consistently high, followed by those aged 40 to 49 and those aged 50 to 59, accounting for the major part. In addition, the number of those aged 20 to 29 was on a decreasing trend whereas the number of those aged 60 to 64 and the number of those aged 65 or older was increasing noticeably. Almost the same trend can be seen with females. Fig. 7-2-3-2 Number of reimprisoned inmates (total/females, by age group) (1999–2008)
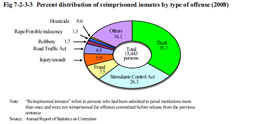
Fig 7-2-3-3 shows the percent distribution of reimprisoned inmates (excluding reimprisoned inmates who were imprisoned for offenses committed before release from the previous sentence; hereinafter the same in this section) by type of offense in 2008. Theft was the highest at 35.7%, followed by Stimulants Control Act violations at 26.3%, fraud at 7.5%, and injury/assault at 5.9%. Theft and Stimulants Control Act violations accounted for over 60%. Fig 7-2-3-3 Percent distribution of reimprisoned inmates by type of offense (2008)
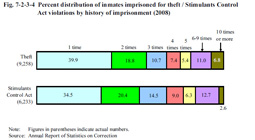
Both for theft and Stimulants Control Act violations, inmates who had been imprisoned three times or more accounted for nearly half, at 41.3% and 45.1% respectively. In addition, inmates who had been imprisoned ten times or more for theft accounted for 6.8%. Fig. 7-2-3-4 Percent distribution of inmates imprisoned for theft / Stimulants Control Act violations by history of imprisonment (2008)
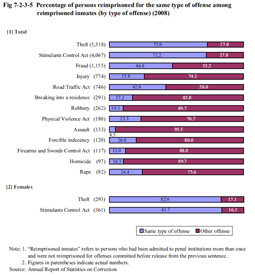
The percentage of persons reimprisoned for the same type of offense as the previous conviction was remarkably high for theft (73.0%) and Stimulants Control Act violations (72.2%) when compared to other offenses. This trend is particularly noticeable for females (82.9% for theft and 83.7% for Stimulants Control Act violations). This then reveals the strong tendency for theft and stimulants offenders to repeat the same type of offense. Fig 7-2-3-5 Percentage of persons reimprisoned for the same type of offense among reimprisoned inmates (by type of offense) (2008)
|