| Previous Next Index Image Index Year Selection | |
|
|
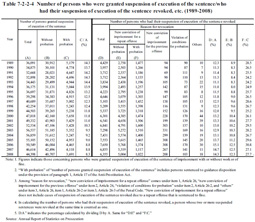
3 Revocation of suspension of execution of the sentence Table 7-2-2-4 shows the number of persons who were granted suspension of execution of the sentence with or without probation and the number of persons who had their suspension of execution of the sentence revoked over the last 20 years, including the reasons for revocation.6,355 persons had their suspension of execution of the sentence revoked in 2008, with 94.8% (6,026 persons) of these being for new convictions of imprisonment or heavier punishment for a repeat offense. The persons who were granted suspension of execution of the sentence in a given year and those whose suspension of execution of the sentence was revoked that year are two different groups, and hence strictly speaking this comparison does not indicate the true revocation rate. It is possible, however, to observe a rough trend of revocation of suspension of execution of the sentence for that year. Examining the rate of persons who had their suspension of execution of the sentence revoked for a new conviction of imprisonment or heavier punishment for a repeat offense (hereinafter referred to as the “suspended execution revocation rate” in this part) in a particular year reveals it to have been 13.6% in 2008, and by type of offense for which suspension of execution of the sentence was granted (limited to offenses for which 100 persons or more were granted suspension of execution of the sentence) the highest for Poisonous and Deleterious Substances Control Act violations at 41.1%, followed by Stimulants Control Act violations (25.5%), and theft (25.2%), in that order (Source: Annual Report of Statistics on Prosecution). Table 7-2-2-4 Number of persons who were granted suspension of execution of the sentence/who had their suspension of execution of the sentence revoked, etc. (1989–2008)
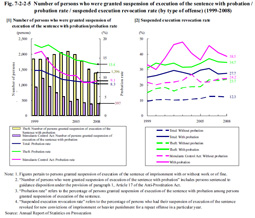
The probation rate has been on a decreasing trend with slight ups and downs, a trend which is particularly noticeable with Stimulants Control Act violations. It decreased from 18.5% in 1999 to 13.4% in 2008 (down 5.1 points over 10 years) for theft and from 16.2% in 1999 to 9.1% in 2008 (down 7.0 points over 10 years) for Stimulants Control Act violations. In addition, the probation rate for theft was consistently higher than the level of all offenses over the last 10 years, while that for Stimulants Control Act violations was at nearly the same level as theft in 2000, but which then decreased to the almost the same level as all offenses from 2006. However, the suspended execution revocation rate for theft and Stimulants Control Act violations was remarkably high when compared to the level of all offenses, in the cases of suspension of execution of the sentence both with and without probation, again indicating a high tendency to repeat these offenses. The suspended execution revocation rate of those who were granted suspension of execution of the sentence with probation is higher than those without probation. This is probably due to the fact that persons whose rehabilitation conditions such as family environment and living situation are poor are more likely to be placed under probation to begin with and hence the risk of repeating offences is relatively high for anyone granted suspension of execution of the sentence with probation. Fig. 7-2-2-5 Number of persons who were granted suspension of execution of the sentence with probation / probation rate / suspended execution revocation rate (by type of offense) (1999–2008)
|