| Previous Next Index Image Index Year Selection | |
|
|
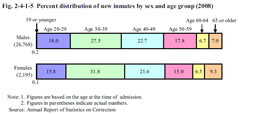
4 Characteristics of new inmates (1) AgeFig. 2-4-1-5 shows the percent distribution of new inmates by sex and age group in 2008. The proportion of those aged 30 to 39 was the highest, for both males and females. The proportion of older inmates was higher for females than males. Fig. 2-4-1-5 Percent distribution of new inmates by sex and age group (2008)
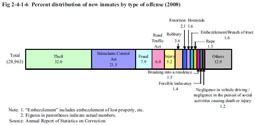
Fig. 2-4-1-6 shows the percent distribution of new inmates by type of offense in 2008. By type of offense, the proportion of theft (32.0%) and Stimulants Control Act violations (21.5%) was extremely high. These two offenses accounted for the majority of new inmates. For females the proportion of Stimulants Control Act violations was the highest at 35.2%, followed by theft (34.9%), fraud (6.6%), homicide (3.7%), and Road Traffic Act violations (3.4%) (See Appendix 2-6). Fig 2-4-1-6 Percent distribution of new inmates by type of offense (2008)
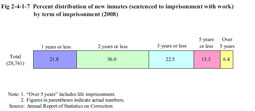
Examining the type of sentence of new inmates in 2008 revealed that 28,761 persons (99.3%) were sentenced to imprisonment with work, 184 (0.6%) to imprisonment without work, and three to misdemeanor imprisonment without work. Fig. 2-4-1-7 shows the percent distribution of new inmates (limited to those sentenced to imprisonment with work) by term of imprisonment in 2008 (See Appendix 2-10 for the number of inmates sentenced to imprisonment with work by term of imprisonment at the end of each year). Fig 2-4-1-7 Percent distribution of new inmates (sentenced to imprisonment with work) by term of imprisonment (2008)
The percentage of first-time inmates (persons imprisoned for the first time) among new inmates was 46.1% in 2008 (See Appendix 2-8 for the histories of imprisonment of new inmates by type of offense). |