| Previous Next Index Image Index Year Selection | |
|
|
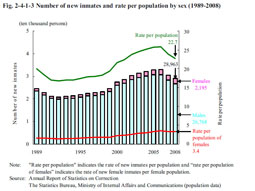
3 Number of new inmates Fig. 2-4-1-3 shows the number of new inmates (refers to sentenced inmates newly admitted to penal institutions each year for execution of the sentence, equivalent to “newly admitted inmates” in the Annual Report of Statistics on Correction; hereinafter the same) over the last 20 years.After reaching a post WWII low (20,864 persons) in 1992, the number of inmates continued increasing consistently, but has been decreasing for two consecutive years since 2007. Fig. 2-4-1-3 Number of new inmates and rate per population by sex (1989–2008)
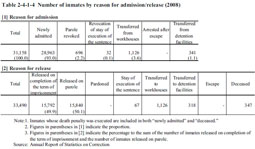
Table 2-4-1-4 Number of inmates by reason for admission/release (2008)
|