| Previous Next Index Image Index Year Selection | |
|
|
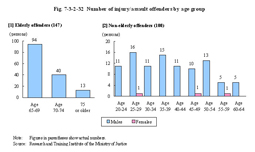
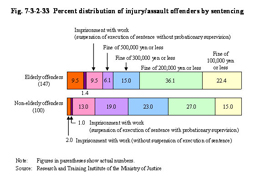
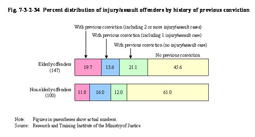
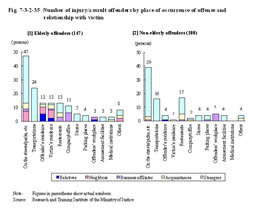
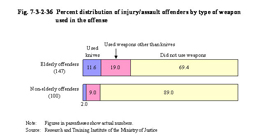
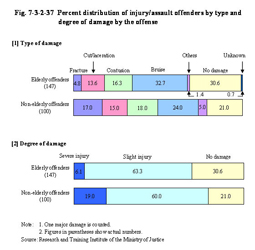
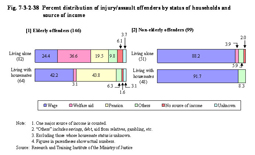
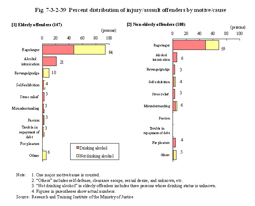
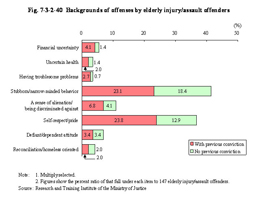
3 Injury/assault The research subjects for injury/assault cases were 147 elderly offenders received for injury/assault by Tokyo District Public Prosecutors Office (head office only) and Tokyo Local Public Prosecutors Office during the period from January 1, 2005 to December 31, 2007 who were convicted or handed summary orders in a court of first instance and whose criminal case documents were available (hereinafter referred to as “elderly injury/assault offenders” in this sub-section). In addition, subjects for comparison were 100 persons selected from those younger than 65 years of age received for injury/assault by Tokyo District Public Prosecutors Office (head office only) and Tokyo Local Public Prosecutors Office during the period from November 1 to December 31, 2007 who were convicted or handed summary order in a court of first instance and whose criminal case documents were available (hereinafter referred to as “non-elderly injury/assault offenders” in this sub-section). These subjects were compared and analyzed regarding their modus operandi, place of occurrence of the offense, motive/cause, and the offenders themselves, etc. by reviewing their criminal case documents, as also done for theft cases. (2) Cases of elderly injury/assault offenders Relatively common cases of elderly injury/assault offenders in this research are given below. [1] A case of a violent act against a station staff while drunk Male aged 65. No previous conviction. The offender was living with his wife and children and making a living through apartment rental income and his pension. On the way home from a class reunion the offender was drunk and fell asleep in a station. When a station staff member spoke to him, the offender assaulted the staff member. Fined 100,000 yen. [2] A case of a violent act against a neighbor who had retorted after being given a complaint Male aged 81. No record of marriage, living alone on pension after retirement. No previous conviction. The offender made a complaint to a female neighbor acquaintance (aged 58) who was feeding stray cats. When she retorted, the offender brought his umbrella down on her in rage to get her bruised. Fine of 200,000 yen. [3] A case of a violent act against a pedestrian resulting from a quarrel over traffic Male aged 68. The offender was living with a wife and children and making a living on his pension and income from a part-time job. The offender had four previous convictions, of which three were for injury/assault cases. As the offender was going out, a male juvenile (aged 17) was in his way skateboarding, and the offender made a complaint. When the young male answered back the offender hit the juvenile in a rage, resulting in bruising. The offender was drunk at the time. Fined 150,000 yen. [4] A case of a homeless person getting drunk who then committed a violent act against male juveniles Male aged 65. Homeless. The offender was earning money by gathering used books. The offender had a tendency of getting into interpersonal conflicts when under the influence of alcohol. The offender had no previous conviction but previous dispositions for injury and assault. In this particular case the offender found male juveniles (aged 9), who were playing in a park, annoying, took their bat away from them and then hit them with it, resulting in bruising. The offender was drunk at the time. Sentenced to imprisonment with work for one year. (3) Attributes/circumstances, etc. of elderly injury/assault offenders Elderly injury/assault offenders were all males. However, among non-elderly injury/assault offenders, 97 were males and three were females. Fig. 7-3-2-32 shows the number of offenders by age group at the time of conviction or when handed summary orders. Among elderly injury/assault offenders, the oldest was 88 years of age and the average age was 69.1. The number of offenders in the age group of 69 or younger was 94 (63.9%), that of 70 to 74 was 40 (27.2%), and in total these two groups accounted for about 90%. The average age of non-elderly injury/assault offenders was 39.2. Fig. 7-3-2-32 Number of injury/assault offenders by age group Fig. 7-3-2-33 shows the percent distribution of injury/assault offenders by sentence. The number of offenders sentenced to fines was 117 (79.6%) for elderly injury/assault offenders and 84 (of 100) for non-elderly injury/assault offenders, both accounting for nearly 80%. In addition, the percent ratio of those sentenced to imprisonment with work (without suspension of execution of sentence) was higher, with 14 persons (9.5%), than that of non-elderly injury/assault offenders.Fig. 7-3-2-33 Percent distribution of injury/assault offenders by sentencing Fig. 7-3-2-34 shows the percent distribution of injury/assault offenders by history of previous conviction. Among elderly injury/assault offenders, 80 persons (54.4%) had previous convictions, of which 49 persons (61.3% of those with previous convictions) had previous convictions for injury/assault. In addition, among elderly injury/assault offenders, 34 persons (23.1%) had previous imprisonment and four persons (2.7%) were related to Boryokudan. A certain number of offenders with high criminal tendencies exist among elderly injury/assault offenders, with quite a few having a habitual violent offense tendency, but many did have low criminal tendencies when compared to theft offenders. Among non-elderly injury/assault offenders, 39 persons had previous convictions, of which 27 persons (69.2% of those with previous convictions) had previous convictions for injury/assault, and eight persons were related to Boryokudan. Elderly injury/assault offenders had a higher percent ratio of offenders with multiple numbers of previous criminal records than non-elderly injury/assault offenders.Most offenses by the elderly injury/assault offenders were committed alone, with only three offenders having accomplices. On the other hand, among non-elderly injury/assault offenders, 19 offenders had accomplices, of which 12 had committed offenses with friends, and two with those related to Boryokudan. Fig. 7-3-2-34 Percent distribution of injury/assault offenders by history of previous conviction Fig. 7-3-2-35 shows the number of injury/assault offenders by place of occurrence of offense and relationship with victims. Among elderly injury/assault offenders, those committing offenses on streets/parks, etc. were the most common at 47 persons (32.0%), followed by transportation, including buses and trains, etc., with 24 persons (16.3%), while offenders' residences and victims' residences with both 13 persons (8.8%). By relationship with the victim, those committing offenses against strangers accounted for the majority with 90 persons (61.2%), against neighbors with 20 persons (13.6%), against acquaintances with 15 persons (10.2%), and against business affiliates with 14 persons (9.5%).By place of occurrence of offense and relationship with victims, of the 47 persons committing offenses on streets/parks, etc. 34 (72.3%) were against strangers, while 24 persons that committed offenses on transportation were all against strangers. Of these 24 persons committing offenses on transportation, 22 were drunk, and many of these cases were offenses against station staff members or taxi drivers as a result of being intoxicated/drunk while going out. Of those who committed offenses on transportation 11 (45.8%) had no previous conviction/disposition. Of 34 persons committing offenses on streets/parks, etc. against strangers, 21 had previous convictions (of which 14 had been convicted for injury/assault) and 10 had no previous conviction/disposition. 17 persons were recognized as being drunk, of which 11 had previous convictions (of which seven had been convicted for injury/assault), and four had no previous conviction/disposition. Furthermore, among cases in which the victims were neighbors, offenses were committed at the offenders' residence, on streets/parks, etc., or in the neighborhood, and of 20 offenders 10 were drunk while 10 had previous convictions. On the other hand, among non-elderly injury/assault offenders, streets/parks, etc. was the most common for the place of occurrence of offense with with 39 persons, followed by at restaurants with 17 persons, and on transportation with 16 persons. The place of occurrence of offense ranges widely among both elderly injury/assault offenders and non-elderly injury/assault offenders, and includes amusement facilities, workplaces, parking spaces, and stores. This indicates that elderly injury/assault offenders had as broad a range of daily living and activities as non-elderly injury/assault offenders. Upon examining the differences the percent ratio of at restaurants was slightly higher among non-elderly injury/assault offenders, while the percent ratio of at offenders' residences and the victims' residences were rather high, and a few cases also took place at medical institutions among elderly injury/assault offenders. By relationship with the victim, a large number of non-elderly offenders committed offenses against strangers (81 persons), as did elderly injury/assault offenders. On the other hand, only one non-elderly injury/assault offender committed an offense against a neighbor when compared to 20 persons among elderly injury/assault offenders, indicating that although the range of activities was expanding, relationships with neighbors was one of the major interpersonal relationships with the elderly. Fig. 7-3-2-35 Number of injury/assault offenders by place of occurrence of offense and relationship with victim Fig. 7-3-2-36 shows the percent distribution of injury/assault offenders by type of weapon used in the offense. Among elderly injury/assault offenders, 17 (11.6%) persons used knives while 28 persons (19.0%) used something else. On the other hand, among non-elderly injury/assault offenders, 89 persons did not use weapons. The percent ratio of those who used weapons was more remarkable with elderly injury/assault offenders than with non-elderly injury/assault offenders, thus reflecting that quite a few elderly were not confident of their physical strength and had used weapons to supplement it.Fig. 7-3-2-36 Percent distribution of injury/assault offenders by type of weapon used in the offense Fig. 7-3-2-37 shows the percent distribution of injury/assault offenders by type and degree of damage inflicted by the offense. Among elderly injury/assault offenders, 48 persons (32.7%) inflicted bruising and seven persons (4.8%) inflicted bone fractures. By the degree of damage, 45 persons (30.6%) inflicted no damage and nine persons (6.1%) inflicted serious damage.Among non-elderly injury/assault offenders, 24 persons inflicted bruising, 17 persons inflicted bone fractures, and 21 persons inflicted no damage. Although more elderly injury/assault offenders used weapons than non-elderly injury/assault offenders, the percent ratio of minor damages was higher with elderly injury/assault offenders than with non-elderly injury/assault offenders. Fig. 7-3-2-37 Percent distribution of injury/assault offenders by type and degree of damage by the offense Fig. 7-3-2-38 shows the percent distribution of injury/assault status of households and source of income at the time of offense. Among elderly injury/assault offenders, those who were living alone accounted for the majority with 82 persons (56.2%). Compared to the elderly theft offenders given in two of this section, however, the percent ratio of those living alone was low. In addition, the average monthly income was 213,000 yen, more than two times than that of the 94,000 yen for elderly theft offenders. However, the average monthly income of non-elderly injury/assault offenders was 288,000 yen, remarkably higher than that of the 122,000 yen of non-elderly theft offenders.Fig. 7-3-2-38 Percent distribution of injury/assault offenders by status of households and source of income Fig. 7-3-2-39 shows the number of injury/assault offenders by major motive/cause and state of inebriation at the time of the offense.Among elderly injury/assault offenders, the major motive/cause of offenses was “anger/rage” with 94 persons (63.9%), “alcohol intoxication”, in which the effect of drinking alcohol was obvious such as in being dead drunk with 21 persons (14.3%), and “revenge/grudge” with 10 persons (6.8%). Among elderly injury/assault offenders, 79 persons (53.7%) were recognized as being drunk at the time of offense. Including cases in which drinking was not the major cause, 73 persons (49.7%) seemed to have at least been somewhat affected by alcohol. In addition, the percent ratio of being drunk among cases of “anger/rage” as the major motive/cause was 47 of 94 persons (50.0%), while that of a “misunderstanding” caused by the perceived reality of the offenders being wrong was two of three persons. Conversely, only one of 10 persons with the major motive/cause of “revenge/grudge” was recognized as being drunk. On the other hand, for non-elderly injury/assault offenders the major motive/cause of offenses were “anger/rage” with 69 persons, “alcohol intoxication” with six persons, a “misunderstanding” with six persons, “for pleasure” or fighting for pleasure, etc. with four persons, and “self-exhibition” or displaying their authority through violence, etc. with four persons. Among non-elderly injury/assault offenders, 72 persons were recognized as being drunk at the time of the offense. Including cases in which drinking was not the major cause, 64 persons seemed to have been somewhat affected by alcohol. These percent ratios were both higher among non-elderly injury/assault offenders than elderly injury/assault offenders. In addition, the percent ratio of being drunk among cases of “anger/rage” as the major motive/cause was 49 of 69 persons (71.0%), that of “misunderstanding” four of six persons, that of “for pleasure” all of four persons, and that of “revenge/grudge” all of three persons. Fig. 7-3-2-39 Percent distribution of injury/assault offenders by motive/cause Fig. 7-3-2-40 shows the backgrounds of offenses by elderly injury/assault offenders. Among elderly injury/assault offenders, “stubborn/narrow-minded behavior” was the most common with 61 persons (41.5%), followed by “self-respect/pride” with 54 persons (36.7%), and “a sense of alienation/being discriminated against” with 16 persons (10.9%). The percent ratios of those with previous convictions were high in all the groups and particularly high in the cases of “self-respect/pride”.Fig. 7-3-2-40 Backgrounds of offenses by elderly injury/assault offenders (4) ConclusionIn many of these injury/assault cases, various complicated factors, including individual attributes, environments, and relationships with victims, etc. contribute, and individual cases significantly differ from each other. Therefore, not many differences in characteristics between elderly injury/assault offenders and non-elderly injury/assault offenders are clearly observable, but the following characteristics were observed. Among elderly injury/assault offenders, the percent ratio of those with previous convictions was higher, more lived with families and had relatively good incomes, and in the majority of cases the offenders had been affected by alcohol, when compared to non-elderly injury/assault offenders. Many minor ones are included in these cases, for example, a case in which an elderly living normal lives went out and drank alcohol to get dead drunk, got involved in trouble with staff or other passengers, etc. while using transportation, and then committed offenses. Although no elderly injury/assault offender committed offenses for pleasure, as did non-elderly injury/assault offenders, the place of occurrence of offense varied as widely as non-elderly injury/assault offenders and the motives, etc. revealed no significant differences. And hence quite a few offenses resulted from a wide range of activities and interpersonal relationships. Compared to non-elderly injury/assault offenders, however, the number of offenses resulted from getting into trouble with neighbors was noticeable, reflecting that associating with neighbors tends to be a major interpersonal relationship for elderly. In addition, quite a few elderly injury/assault offenders repeated violent offenses such as getting into trouble with strangers over trifles in public areas such as on the streets and parks, etc. and then committing violent offenses. The majority of them had previous convictions and quite a few were homeless or had no stable residence. The percent ratio of those who had previous convictions was relatively high, when compared to non-elderly injury/assault offenders, and so was that of “stubborn/narrow-minded behavior” and “self-respect/pride”. Considering these, it would appear that as their criminal tendencies progress they may have developed cognitive problems, etc. In this research, three elderly injury/assault offenders were recognized definite alcoholics. The percent ratio of being drunk at the time of the offense was higher among non-elderly injury/assault offenders than elderly injury/assault offenders, and discussions on the relationship between drinking alcohol and committing violent offenses are essential. |
