| Previous Next Index Image Index Year Selection | |
|
|
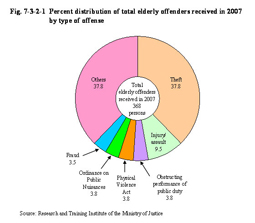
1 Attributes, etc. of elderly offenders Using the following cases the attributes of elderly offenders are clarified through describing the type of offense, criminal/conviction records, living situation such as residential status/housemates etc, financial situation such as employment status/source of income etc, history of having a disorder/disability, history of substance addiction, status of problematic activities including in relation to Boryokudan, problematic gambling, etc, and the background of their committing offenses, etc. (1) Cases of elderly offenders The following four groups are first described as sample cases regarding the attributes of elderly offenders. Here, the “group of elderly first-time offenders” refers to those with no recorded convictions (including disposition for trivial offenses and suspension of prosecution) or conviction records, the “group of offenders with previous dispositions” refers to those with at least one recorded conviction but no conviction record, the “group of offenders with previous convictions” refers to those with at least one conviction record but no imprisonment, and the “group of offenders with previous imprisonment” refers to those imprisoned at least once (hereinafter all referred to as the same in this sub-section). [1] A “group of elderly first-time offenders” case (groping in a train) Male aged 65. No previous disposition/conviction, employed by a company after graduating from high school and worked there for 40 years, and reemployed after retiring. Owns a residence and had no financial problems. No particular family problems with his wife living together and with independently living children. The offender touched the lower half of a woman's body, etc. in a subway train while on the way home from work. Fined 300,000 yen. [2] A “group of offenders with previous dispositions” case (shoplifting of groceries, etc.) Female aged 67. Living quietly with her husband who was a company employee and her children until age 64. After her children became independent and she started living with her husband only, the offender lost her purse at a supermarket nearby. She then tried to make up for the monetary loss by shoplifting commodities, which she then repeated a number of times. The offender was given suspension of prosecution twice. The offender again committed shoplifting of groceries, etc. Fined 300,000 yen. [3] A “group of offenders with previous convictions” case (assault while intoxicated with alcohol) Male aged 69. Before this particular case the offender had been convicted for drunk driving and driving without a license, both being punished by fines. After graduating from high school the offender was employed by a construction company. After retiring under the age limit the offender's wife died. His children then became independent and he lived alone on his pension. Due to loneliness the offender started to frequently appear drunk in public. In this particular case, on the way home, being drunk, the offender was given a warning by a subway station staff member. The offender hit the station staff member in a rage. Fined 150,000 yen. [4] A “group of offenders with previous imprisonment” case (habitually bilking on restaurant bills) Male aged 73. 44 convictions and dispositions, of which 19 were for bilking on restaurant bills, and imprisoned 19 times. After graduating from junior high school the offender had job hopped and temporarily joined a Boryokudan. The offender repeated violent offenses such as injury and assault, etc. while young, but then started repeatedly bilking on restaurant bills in his 40s. The offender is fond of alcohol and in fact an alcohol-dependent. The offender was staying at a common lodging house and receiving welfare aid. Having spent his money on alcohol and been pressed for money because of it, the offender bilked a restaurant bill. Sentenced to imprisonment with work for two years. (2) Type of offense committed by elderly offenders and their previous convictions/dispositions Fig. 7-3-2-1 shows the percent distribution of elderly offenders in this research by type of offense. Fig. 7-3-2-1 Percent distribution of total elderly offenders received in 2007 by type of offense
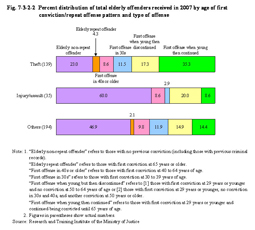
Examination on all the elderly offenders received in 2007 about the age at which they started committing offenses at and how they repeated offenses was conducted. First, they were divided into three groups by type of offense of theft, injury/assault, and others. Fig. 7-3-2-2 shows the percent distribution of elderly offenders in each group by category used in the previous section combining the age of their first conviction and the pattern with repeat offenses. With theft, “first offense when young then continued” accounted for the largest proportion at 35.3%, followed by “first offense at an elderly age” (23.0%), and “first offense when young then discontinued” (17.3%). For injury/assault, on the other hand, “first offense at an elderly age” accounted for the overwhelming majority at 60.0%, followed by “first offense when young then discontinued” (20.0%), “first offense in 40s or older” (8.6%), and “first offense when young then continued” (8.6%). Fig. 7-3-2-2 Percent distribution of total elderly offenders received in 2007 by age of first conviction/repeat offense pattern and type of offense
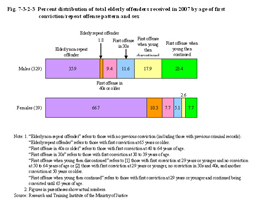
Fig. 7-3-2-3 Percent distribution of total elderly offenders received in 2007 by age of first conviction/repeat offense pattern and sex
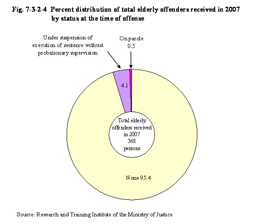
15 (4.1%) were under suspension of execution of sentence without probationary supervision and two (0.5%) on parole. Fig. 7-3-2-4 Percent distribution of total elderly offenders received in 2007 by status at the time of offense
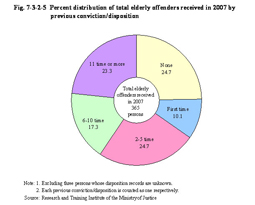
90 (24.7%) had no previous conviction/disposition but 275 (75.3%) with previous conviction/disposition (excluding three persons whose disposition records are unknown). Fig. 7-3-2-5 Percent distribution of total elderly offenders received in 2007 by previous conviction/disposition
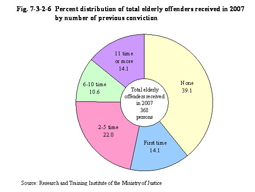
144 (39.1%) had no previous conviction while 224 persons (60.9%) did. Fig. 7-3-2-6 Percent distribution of total elderly offenders received in 2007 by number of previous conviction
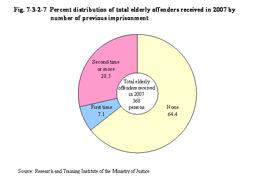
131 (35.6%) had been previously imprisoned. Fig. 7-3-2-7 Percent distribution of total elderly offenders received in 2007 by number of previous imprisonment
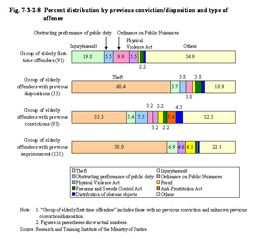
Elderly offenders are analyzed for each of the items given below with attention paid to their history of conviction/disposition/imprisonment and are categorized into four groups, as done earlier, of “group of elderly first-time offenders” (no previous conviction/disposition), “group of offenders with previous dispositions” (with previous dispositions but no previous conviction), “group of offenders with previous convictions” (with previous convictions but no previous imprisonment) , and “group of offenders with previous imprisonment” (previously imprisoned at least once) according to their criminal tendencies. Fig. 7-3-2-8 shows the percent distribution for each group by type of offense. Among the “group of elderly first-time offenders” injury/assault was the most common at 19.8%, followed by Ordinance on Public Nuisances violations (9.9%), obstructing performance of public duty (5.5%), and Physical Violence Act violations (5.5%). There were no theft cases in this group. Among the “group of offenders with previous dispositions” theft was the most common at 60.4%, followed by injury/assault (5.7%), obstructing performance of public duty (3.8%), Ordinance on Public Nuisance violations (3.8%), and Firearms and Swords Control Act violations (3.8%). Among the “group of offenders with previous convictions” theft was the most common at 33.3%, followed by obstructing performance of public duty (7.5%), injury/assault (5.4%), Anti-Prostitution Act violations (5.4%), and Distribution of obscene objects, etc. (4.3%). Among the “group of offenders with previous imprisonment” theft was the most common at 58.0%, followed by injury/assault (6.9%), fraud (6.1%), and Physical Violence Act violations (4.6%). Fig. 7-3-2-8 Percent distribution by previous conviction/disposition and type of offense
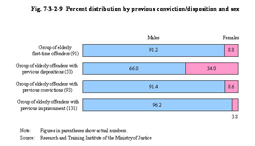
The percent ratio of females was low at less than 10% for each group except the “group of offenders with previous disposition”, with which the female rate was rather high at 34.0%. Fig. 7-3-2-9 Percent distribution by previous conviction/disposition and sex
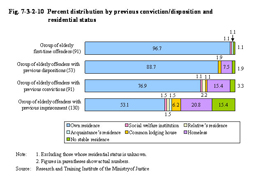
Fig. 7-3-2-10 shows the percent distribution of respective groups by residential status. As their criminal tendencies progress from the “group of elderly first-time offenders” to the “group of offenders with previous imprisonment”, the percent ratio of those with no stable residence (total of common lodging houses, homeless, and no fixed residence) tends to increase. Among the “group of offenders with previous imprisonment”, 42.3% had no stable residence. Fig. 7-3-2-10 Percent distribution by previous conviction/disposition and residential status
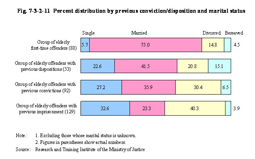
Similar to above, as their criminal tendencies progress from the “group of elderly first-time offenders” to the “group of offenders with previous imprisonment”, the percent ratio of those without spouses (total of single, divorced, and bereaved) increases. The percent ratio of those without spouses for the “group of offenders with previous imprisonment” was 76.7%, or more than three times that for the “group of elderly first-time offenders”. Fig. 7-3-2-11 Percent distribution by previous conviction/disposition and marital status
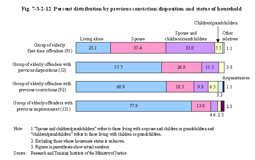
Here again, as their criminal tendencies progress from the “group of elderly first-time offenders” to the “group of offenders with previous imprisonment”, the percent ratio of those living alone increases. The percent ratio of those living alone for the “group of offenders with previous imprisonment” was 77.9%, or over three times that for the “group of elderly first-time offenders”. This ratio is remarkably higher than the ratio of elderly aged 65 or older living alone in Japan, which was15.7% in 2006 (see Fig. 7-1-7 in Section 1 of this part). Fig. 7-3-2-12 Percent distribution by previous conviction/disposition and status of household
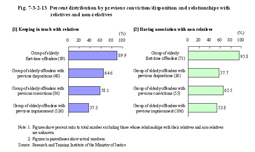
As their criminal tendencies progress from the “group of elderly first-time offenders” to the “group of offenders with previous imprisonment”, the percent ratio of those who had been “keeping in touch with relatives” decreases. The percent ratio of those who had been keeping in touch with relatives for the “group of offenders with previous imprisonment” was 37.3%, or less than half of that for the “group of elderly first-time offenders”. The percent ratio of those who had “associated with non-relatives” for the “group of elderly first-time offenders” was quite high at 95.8%, while that for other groups was 53.8% to 65.5%. As a reference, 52.0% of elderly aged 60 or older in Japan “maintain close relations” with their neighbors, while 40.9% “just exchange greetings” (in 2003) (Source: Annual Report on the Aging Society: 2008). Fig. 7-3-2-13 Percent distribution by previous conviction/disposition and relationships with relatives and non-relatives
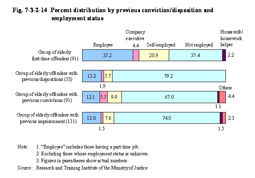
(4) Financial situations of elderly offenders including employment status, source of income, etc. Fig. 7-3-2-14 shows the percent distribution of respective groups by employment status. Although the percent ratio of those employed (total of employees, company executives, and self-employed) was especially low for the “group of offenders with previous dispositions” (20.8%), the percent ratio of those employed generally decreases as their criminal tendencies progress from the “group of elderly first-time offenders” to the “group of offenders with previous imprisonment”. While the percent ratio of those employed was 60.4% for the “group of elderly first-time offenders”, that of the “group of offenders with previous imprisonment” was about 1/3 of the former group. Compared to the employment rate of elderly in Japan, which is 49.5% for males aged 65 to 69 and 28.5% for females aged 65 to 69 (Source: Annual Report on the Aging Society: 2008), the percent ratio of those employed for the groups (20.8% to 27.5%), excluding the “group of elderly first-time offenders”, is significantly low. Fig. 7-3-2-14 Percent distribution by previous conviction/disposition and employment status
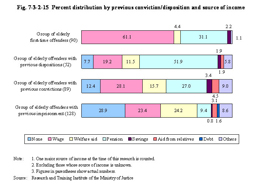
There was no “no income source” for the “group of elderly first-time offenders”, but the percent ratio of “no income source” does increase with the “group of offenders with previous criminal records” through to the “group of offenders with previous imprisonment”, in that order. In addition the percent ratio of those receiving “welfare aid” increases similarly with 24.2% for the “group of offenders with previous imprisonment”. This is remarkably high when compared to the ratio of elderly aged 65 or older in Japan receiving welfare aid population, which was 2.2% in 2006 (Source: Annual Report on the Aging Society: 2008). Fig. 7-3-2-15 Percent distribution by previous conviction/disposition and source of income
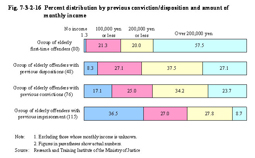
As their criminal tendencies progress from the “group of elderly first-time offenders” to the “group of offenders with previous imprisonment”, the percent ratio of those with “no income” increases. Among the “group of offenders with previous imprisonment”, the percent ratio of “no income” was 36.5% with the total of “no income” and “100,000 yen or less” (annual income of 1,200,000 or less) accounting for 63.5%. This is a significantly low level when compared to the average annual income of elderly households (households consisting of elderly only or with single persons aged 18 or younger), which was 3,019,000 yen (1,890,000 yen per person in the household) in 2005 (see Fig. 7-1-9 in Chapter 1 of this part). Fig. 7-3-2-16 Percent distribution by previous conviction/disposition and amount of monthly income
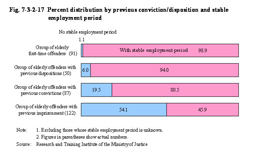
As their criminal tendencies progress from the “group of elderly first-time offenders” to the “group of offenders with previous imprisonment”, the percent ratio of those with “no stable employment period” increases sharply. Among the “group of offenders with previous imprisonment” the percent ratio of “no stable employment period” was 54.1%. Fig. 7-3-2-17 Percent distribution by previous conviction/disposition and stable employment period
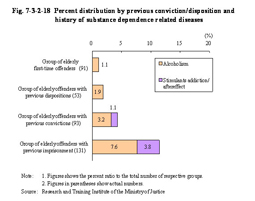
(5) Histories of disorders/disabilities, substance dependence related disorders, etc. of elderly offenders Histories of disorders/disabilities are found in about half the elderly offenders, which is about the same level as the ratio of elderly aged 65 or older in Japan who are aware of their disease or injury (excluding those hospitalized), being 493.1 persons per 1,000 population in 2004 (Source: Annual Report on the Aging Society: 2008). One of the causes of offenses being committed by elderly may be health problems. Since the histories of disease/disabilities for elderly offenders are at the same level as that with elderly in general, however, it suggests that health problems are not the major cause of offense acts by elderly. Fig. 7-3-2-18 shows the histories of substance addiction related diseases of respective groups. As their criminal tendencies progress from the “group of elderly first-time offenders” to the “group of offenders with previous imprisonment”, the percent ratio of those with “histories of substance dependence related diseases” increases. For the “group of offenders with previous imprisonment” it was 11.5%. Fig. 7-3-2-18 Percent distribution by previous conviction/disposition and history of substance dependence related diseases
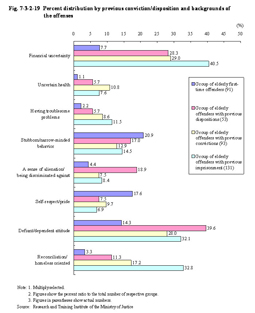
A history of relationship with Boryokudan accounted for 8.6% among the “group of offenders with previous convictions” and 21.4% among the “group of offenders with previous imprisonment”. As their criminal tendencies progress, the percent ratio of those who have had relationship with Boryokudan increases significantly. On the other hand, the percent ratio of a history of problematic gambling also increases with progress in criminal tendencies at 3.8% among the “group of offenders with previous dispositions”, 8.6% among the “group of offenders with previous convictions”, and 18.3% among the “group of offenders with previous imprisonment”. In order to prevent repeated offenses by elderly offenders, guidance on breaking away from Boryokudan should be provided at the time of their first offense. For those with gambling problems, continuous as well as careful guidance will need to be provided in making them aware that it could be a cause of them committing offenses. (7) Backgrounds of offenses committed by elderly offenders Lastly, Fig. 7-3-2-19 shows the backgrounds of offenses committed by respective groups. Figures up to Fig. 7-3-2-18 dealt with the items that can be directly identified by reviewing their criminal case documents. In addition to those items, supplemental research on the following items was conducted to better understand the background of offenses committed by elderly offenders. Although these items cannot always be easily identified by reviewing their criminal case documents, conceivable background factors behind the cases were determined through comprehensive evaluation taking into consideration details/motives of the offense, circumstances, previous conviction/disposition, and previous life attitudes/employment status. More concretely, [1] “financial uncertainty” refers to cases behind which present or future financial uncertainties such as “feeling difficulty in living due to low income” or “wondering what to do when savings run out?”, etc. seem to exist, [2] “uncertain health” refers to cases behind which such factors as anxiety over declining physical strength and diseases due to aging or fear of death, etc. seem to exist, [3] “having troublesome problems” refers to cases behind which hard pressed states of mind such as “not knowing who to rely on”, “not wanting to cause any trouble”, or being unable to rely on the government due to lack of knowledge and understanding of welfare, etc. seems to exist, [4] “stubborn/narrow-minded behavior” refers to cases behind which stubborn behavior with distorted ways of thinking such as “I haven't done anything wrong”, the incapacity to make proper judgments or to understand things, or difficulty in communicating with others because of an inability to have flexible ways of thinking seem to exist, [5] “a sense of alienation/being discriminated against” refers to cases behind which such factors as having a feeling of “being disliked or ignored” or living a solitary life with weak interpersonal relationship seem to exist, [6] “self-respect/pride” refers to cases behind which such discontent as “having a feeling of being looked down on by young people”, “unable to bear the way they are treated by others at an elderly age after having working so hard for such a long time”, or “not being respected as an elder” seem to exist, [7] “defiant/dependent attitude” refers to cases behind which such silly thinking as “small offenses will be overlooked as I am elderly” seems to exists, and [8] “reconciliation/homeless oriented” refers to cases behind which psychological tendencies to escape from reality and give up what one had built up or a lack of motivation seem to exist. Fig. 7-3-2-19 Percent distribution by previous conviction/disposition and backgrounds of the offenses
(8) Conclusion The attributes of elderly offenders were analyzed through categorizing them into four groups according to the level of their criminal tendencies. It was shown that, as criminal tendencies of elderly offenders progress, the percent ratio of those living alone, of unstable residential status, and with no income increases as they have no one around to protect/supervise them, and become financially unstable. Included among them were those with physical/mental diseases, histories of relationship with Boryokudan, and problematic gambling. Taking these into consideration, providing proper correspondence in a timely manner according to the level of their criminal tendencies will be an effective measure in preventing elderly from committing offenses. In order to achieve this, not only criminal justice organizations but also medical/welfare agencies, local governments, etc. will need to cooperate with each other. In addition, support from community residents and the establishment of a system to prevent elderly from being isolated, including securing them employment, etc., will also be required. |