| Previous Next Index Image Index Year Selection | |
|
|
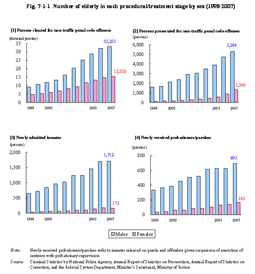
1 Increase in the number of elderly offenders and current status of the aging society in Japan However, as detailed later, the number of offenders cleared for non-traffic penal code offenses by age group is either leveling off or increasing for adults in respective age groups, and with a marked increase in those of advanced age. “Elderly” refers to anybody aged 65 or older (hereinafter the same). In previous editions of the White Paper on Crime, the word “elderly” was used to refer to those 60 or older, due to the limitation of the age categorization used in old statistics on criminal justice. There is no such limitation, however, in the statistics used in this edition, and hence the definition of “elderly” has been changed to refer to those 65 or older so as to remain in accordance with recent general usage. Fig. 7-1-1 shows the number of elderly in each procedural/treatment stage of police, prosecution, correction, and rehabilitation (hereinafter referred to as “each procedural stage” in this chapter) by sex. Fig. 7-1-1 Number of elderly in each procedural/treatment stage by sex (1998–2007)
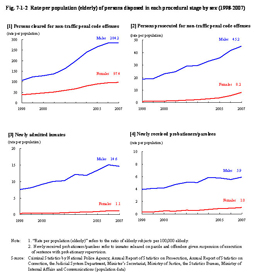
Fig. 7-1-2 shows the rate per population (ratio of subjects per 100,000 persons, and the “rate per population (elderly)” specifically refers to the ratio of elderly subjects per 100,000 elderly; hereinafter the same in this part) of elderly disposed in each procedural stage for comparing the increasing trend in the number of elderly offenders with that in the population of elderly. Fig. 7-1-2 Rate per population (elderly) of persons disposed in each procedural stage by sex (1998–2007)
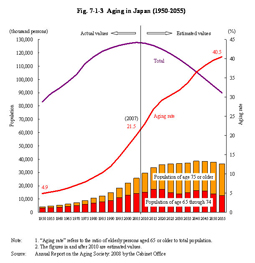
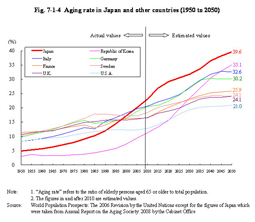
As part of the background for that increase in the number of elderly offenders, the sharp increase in the elderly population in Japan needs referring to. Fig. 7-1-3 shows changes and future estimates with the aging of Japan. According to the “Annual Report on the Aging Society: 2008” the population in Japan remained at the same level as the previous year with 127.77 million as of October 1, 2007. The number of persons aged 65 or older, however, reached the record high of 27.46 million (26.6 million the previous year), with the ratio to total population (aging rate) being 21.5% (20.8% (id.)). The aging rate in Japan was less than 5% in 1950, exceeded the level of an “aging society” at 7% in 1970, and reached 14% in 1994 in becoming an “aged society”. It has now passed 21% and Japan has become a “truly aged society” in which one in every five persons is elderly. Moreover, the total population of Japan has entered a long-term decline, the estimate is that the population of elderly will exceed 30 million in 2012 when the so-called “baby-boom generation” will reach 65 years old and that it will continue to increase until 2042, resulting in the type of aged society that no other country in the world has ever experienced. In addition, aging is progressing faster in Japan than any other country in the world. Fig. 7-1-4 shows the aging rate in Japan and other countries. The aging rate in Japan is higher than that in the Republic of Korea, Europe, and the U.S.A., where aging is also progressing, and that trend is expected to continue into the future. Fig. 7-1-3 Aging in Japan (1950–2055)
Fig. 7-1-4 Aging rate in Japan and other countries (1950 to 2050)
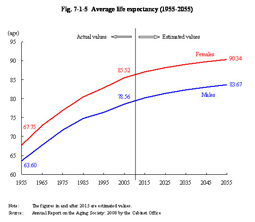
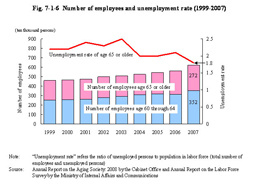
Fig. 7-1-5 shows the changes and future estimates of average life expectancy in Japan. Average life expectancy has increased for both males and females when compared to 1955, and at present at 65 years old is another 15 years for males and 20 years for females. Even at an advanced age both males and females have adequate physical strength and the range of activities that elderly can involve themselves in seems to have increased accordingly. Fig. 7-1-6 shows an example of this with the number of employed elderly. The number of employed elderly is increasing in Japan, thus indicating their growing opportunities for social participation. Fig. 7-1-5 Average life expectancy (1955–2055)
Fig. 7-1-6 Number of employees and unemployment rate (1999–2007)
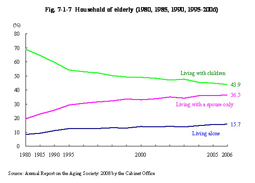
In recent years the number of elderly living with their children has decreased, while in contrast the number of those living alone or with their spouse only is increasing. Fig. 7-1-7 Household of elderly (1980, 1985, 1990, 1995–2006)
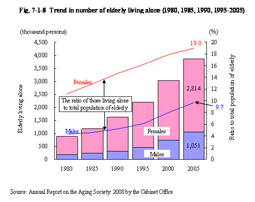
Fig. 7-1-8 Trend in number of elderly living alone (1980, 1985, 1990, 1995–2005)
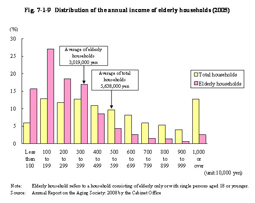
Fig. 7-1-9 shows the distribution of the annual income of elderly households. Fig. 7-1-9 Distribution of the annual income of elderly households (2005)
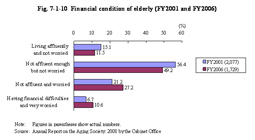
Fig. 7-1-10 Financial condition of elderly (FY2001 and FY2006)
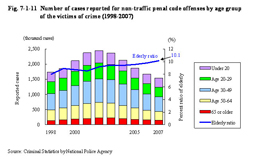
The relationship between the increase in number of offenses and the situation in which isolation and solitary habits is progressing in elderly persons' lives, leading to growing economic uncertainty is examined again in Chapter 3, Section 2. In addition, as more elderly are involving themselves in social activities, the number of cases involving elderly as crime victims is also tending to increase. The ratio of cases in which elderly have been the victims of crime to total number of reported cases (elderly rate) has been slightly increasing. Fig. 7-1-11 shows the number of cases reported for non-traffic penal code offenses by age group of the victims of crime. Fig. 7-1-11 Number of cases reported for non-traffic penal code offenses by age group of the victims of crime (1998–2007)
|