| Previous Next Index Image Index Year Selection | |
|
|
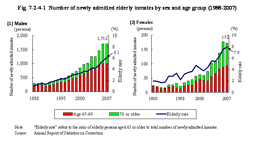
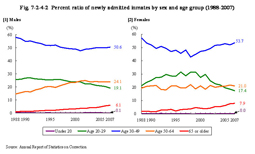
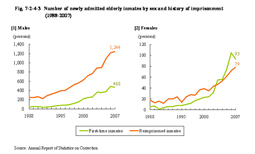
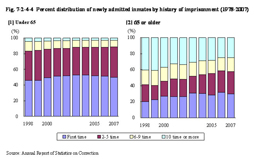
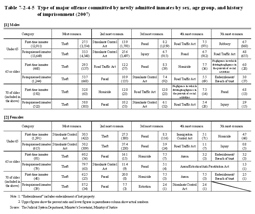
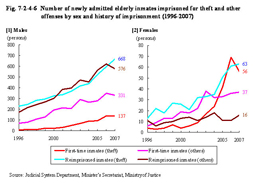
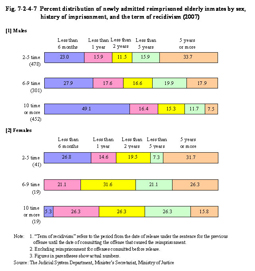
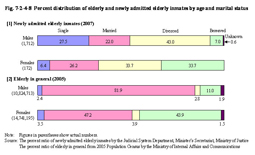
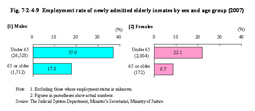
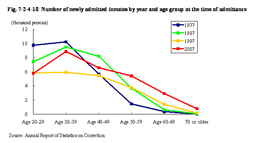
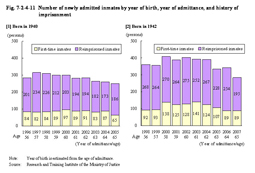
1 Newly admitted inmates Fig. 7-2-4-1 shows the number of newly admitted inmates aged 65 or older and the elderly rate by sex and age group since 1988. Fig. 7-2-4-1 Number of newly admitted elderly inmates by sex and age group (1988–2007) Since 1988 the elderly rate of inmates continued to increase almost consistently for both males and females. The number of newly admitted inmates of age 70 or older was smaller than that of age 65 through 69, but the rate of increase between 1988 and 2007 was about 5.1 times for males aged 65 through 69, about 7.9 times for males aged 70 or older, about 4.4 times for females aged 65 through 69, and about 26.3 times for females aged 70 or older.(2) The percent ratio of newly admitted inmates by sex and age group Fig. 7-2-4-2 shows the percent ratio of newly admitted inmates by sex and age group since 1988. Fig. 7-2-4-2 Percent ratio of newly admitted inmates by sex and age group (1988–2007) For both males and females the elderly rate of newly admitted inmates continued to increase almost consistently, thus indicating the progress in aging among newly admitted inmates.With males the number of newly admitted inmates in 2007 to that of 1988 was about 1.0 times (up by 1,223) in total, about 0.9 times for those under 50 years of age (down by 3,037), about 1.7 times for those aged 50 through 64 (up by 2,834), and about 6.0 times for those aged 65 or older (up by 1,426). With females it was about 1.8 times (up by 985) in total, about 1.7 times for those under 50 years of age (up by 611), about 2.0 times for those aged 50 through 64 (up by 226) and about 7.2 times for those aged 65 or older (up by 148). With both males and females the increase in number of newly admitted elderly inmates is remarkable. (3) The number of newly admitted elderly inmates by sex and history of imprisonment Fig. 7-2-4-3 shows the number of newly admitted elderly inmates by sex and history of imprisonment since 1988. Fig. 7-2-4-3 Number of newly admitted elderly inmates by sex and history of imprisonment (1988–2007) For males the number of reimprisoned inmates was consistently higher than first-time inmates. Since 1988 the number of first-time imprisonments and reimprisonments both has roughly been on an increasing trend. The number of first-time inmates in 2007 was about 11.7 times as that in 1988 and the number of reimprisoned inmates was about 5.1 times as that in 1988.Unlike males, from 2003, the number of first-time female inmates exceeded the number of reimprisoned female inmates. Since 1988 the number of first-time imprisonments and reimprisonments both continued to increase almost consistently. The number of first-time inmates in 2007 was about 15.5 times as that in 1988 and the number of reimprisonments was about 4.4 times as that in 1988. (4) Percent distribution of newly admitted inmates by history of imprisonment Fig. 7-2-4-4 shows the percent distribution of newly admitted inmates by history of imprisonment over the last 10 years. Fig. 7-2-4-4 Percent distribution of newly admitted inmates by history of imprisonment (1978–2007) The percent ratio of inmates imprisoned for multiple times was higher for the elderly than for those under 65 years of age. However, the percent ratio of those imprisoned “10 time or more” has generally decreased while the percent ratio of those imprisoned a few times is increasing.(5) Type of major offense committed by newly admitted inmates Table 7-2-4-5 shows the type of major offense committed by newly admitted inmates by sex, age group, and history of imprisonment in 2007. Table 7-2-4-5 Type of major offense committed by newly admitted inmates by sex, age group, and history of imprisonment (2007) a. MalesTheft was the most common for each category. For newly admitted elderly inmates the percent ratio of Stimulants Control Act violations was low while that for fraud was high when compared to those under 65 years of age. The percent ratio of homicides committed by first-time elderly inmates was higher than that in other categories. For reimprisoned elderly inmates, theft accounted for the majority and the percent ratio of Stimulants Control Act violations was higher than that for first-time elderly inmates. In addition, among newly admitted elderly inmates, 14 were imprisoned for the first time and 34 were reimprisoned for injury while 12 were reimprisoned for homicide. b. Females The percent ratio of Stimulants Control Act violations was high for newly admitted inmates under 65 years of age while the percent ratio for theft and fraud was high for elderly inmates, with theft accounting for the majority. Among elderly inmates the percent ratio of homicides is high, following fraud, for first-time inmates when compared to reimprisoned inmates. For reimprisoned inmates aged 65 or older theft accounted for the major part, followed by Stimulants Control Act violations and fraud in that order. No elderly inmates were imprisoned for injury. (6) The number of newly admitted elderly inmates imprisoned for theft and other offenses by sex and history of imprisonment Fig. 7-2-4-6 shows the number of newly admitted elderly inmates imprisoned for theft and other offenses by sex and history of imprisonment since 1996. Fig. 7-2-4-6 Number of newly admitted elderly inmates imprisoned for theft and other offenses by sex and history of imprisonment (1996–2007) The number of males reimprisoned for theft has been consistently increasing since 1996 and increased by 72 in 2007 from the previous year. The number of first-time female inmates imprisoned for theft has increased noticeably since 1996, but decreased by 13 in 2007 from the previous year. Conversely however, the number of females reimprisoned for theft increased by two from the previous year.In addition, of 1,884 newly admitted elderly inmates in 2007, 924 were imprisoned for theft and of which 193 (20.9%) were imprisoned for the first time and 731 (79.1%) were reimprisoned. Of reimprisoned inmates, 276 (29.9%) had been imprisoned “2 to 5 times”, 173 (18.7%) “6 to 9 times”, and 282 (30.5%) “10 times or more”. The number of newly admitted elderly inmates imprisoned for theft in 2007 increased by about 2.9 times over the previous 10 years in total, reimprisoned inmates by about 2.4 times, those who had been imprisoned for “2 to 5 times” by about 5.5 times, “6 to 9 times” by about 2.5 times, and “10 times or more” by abut 1.5 times, while first-time inmates increased by about 12.1 times. (7) The term of recidivism of newly admitted reimprisoned elderly inmates by sex and history of imprisonment Fig. 7-2-4-7 shows the percent distribution of newly admitted reimprisoned elderly inmates by sex, history of imprisonment, and the term of recidivism (“term of recidivism” refers to the period from date of release under the sentence for the previous offense until the date of committing the offense that caused the reimprisonment; hereinafter referred to as the same in this section). Fig. 7-2-4-7 Percent distribution of newly admitted reimprisoned elderly inmates by sex, history of imprisonment, and the term of recidivism (2007) With males the percent ratio of those with short terms of recidivism increased as the frequency of imprisonment increased. With females the percent ratio of those with short terms of recidivism was high among those with a history of imprisonment of “2 through 5 time”, and of them about 40% had repeated crimes in less than 1 year. With both males and females the term of recidivism was shorter with those who had a history of imprisonment of “10 time or more” than those with “6 through 9 time”.(8) Marital status of newly admitted elderly inmates Fig. 7-2-4-8 shows the percent distribution of newly admitted elderly inmates by age and marital status in 2007 and that of elderly in general in 2005. The percent ratio of married was lower and that of single and divorced was higher for elderly inmates than for elderly in general for both males and females. Fig. 7-2-4-8 Percent distribution of elderly and newly admitted elderly inmates by age and marital status (9) Employment status of newly admitted inmatesFig. 7-2-4-9 shows the employment rate of newly admitted elderly inmates by sex and age group in 2007. Fig. 7-2-4-9 Employment rate of newly admitted elderly inmates by sex and age group (2007) Among elderly inmates, and with both males and females, the employment rate was under 20% and the percent ratio of those unemployed was significantly high when compared to the age group of under 65. However, the employment rate of elderly in general (65 or older) in the same year was higher than that of elderly inmates with both males and females, being 29.1% for males and 12.8% for females (Source: “2007 Annual Report on the Labor Force Survey” by the Ministry of Internal Affairs and Communications).(10) The number of newly admitted inmates by year and age at the time of admittance Fig. 7-2-4-10 shows the number of newly admitted inmates by year and age group at the time of admittance. Fig. 7-2-4-10 Number of newly admitted inmates by year and age group at the time of admittance Roughly speaking, every year the number of inmates decreased as their age increased but the number of newly admitted inmates aged 60 or older is increasing.(11) The number of newly admitted inmates by year of birth, year of admittance, first-time imprisonment, and reimprisonment Fig. 7-2-4-11 shows the number of newly admitted inmates by year of birth, year of admittance, first-time imprisonment, and reimprisonment. Fig. 7-2-4-11 Number of newly admitted inmates by year of birth, year of admittance, and history of imprisonment The number of newly admitted inmates who were born in 1940 and 1942 both gradually decreased as their age increased and no significant change can be seen. |
