| Previous Next Index Image Index Year Selection | |
|
|
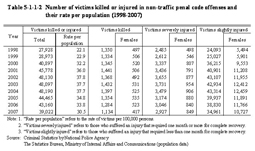
2 Fatal and bodily damage The trends over the last 10 years show that the total number of those who were killed or injured had been on an upward trend until 2004, but it decreased for three consecutive years from 2005. Most of the total number of those who were killed or injured were those who were slightly injured. The rate of females among those killed or injured, rose from 23.2% in 1998 to 30.7% in 2007. Table 5-1-1-2 Number of victims killed or injured in non-traffic penal code offenses and their rate per population (1998–2007)
|