| Previous Next Index Image Index Year Selection | |
|
|
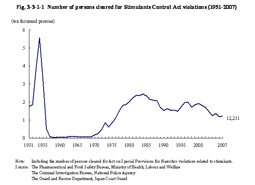
1 Stimulants Control Act violations Stimulants abuse began to become widespread during the chaotic postwar period, however, persons cleared fell sharply after a peak over 50,000 in 1954. As a background, it has been pointed out that penal regulations were tightened, that clearance by police was implemented thoroughly, and that educational campaigns concerning the harmful influence of stimulants were held nationally. However, the number of persons cleared took an upward turn again in 1970 and reached 24,372 in 1984, recording the second peak. After that, the number fell below 20,000 in 1989 and had leveled off until 1994. It started to increase again in 1995 and reached almost 20,000 in 1996, 1997, and 2000. After that, it has generally been on a decreasing trend, but increased slightly in 2007. Fig. 3-3-1-1 Number of persons cleared for Stimulants Control Act violations (1951–2007)
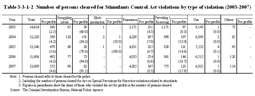
Table 3-3-1-2 Number of persons cleared for Stimulants Control Act violations by type of violation (2003–2007)
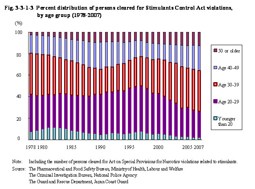
Fig. 3-3-1-3 Percent distribution of persons cleared for Stimulants Control Act violations, by age group (1978–2007)
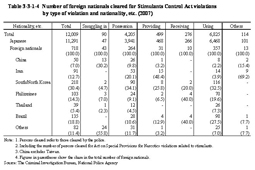
Table 3-3-1-4 Number of foreign nationals cleared for Stimulants Control Act violations by type of violation and nationality, etc. (2007)
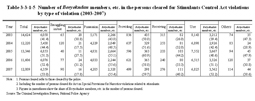
The percent ratio of Boryokudan members, etc. to total persons cleared has been on the rise since 2003, exceeded 50% in 2005, and reached 53.0% in 2007. Table 3-3-1-5 Number of Boryokudan members, etc. in the persons cleared for Stimulants Control Act violations by type of violation (2003–2007)
|