| Previous Next Index Image Index Year Selection | |
|
|
3 Trends by type of offense
(1) Percent distribution by type of offense
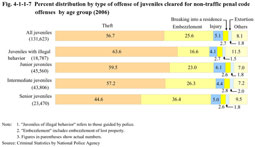
Fig. 4-1-1-7 shows the percent distribution by type of offense of juveniles cleared for non-traffic penal code offenses (including juveniles of illegal behavior who are guided by police) in 2006, by age group. The older an age group was, the lower the percent ratio for theft was (see Appendix 4-3). Fig. 4-1-1-7 Percent distribution by type of offense of juveniles cleared for non-traffic penal code offenses by age group (2006)
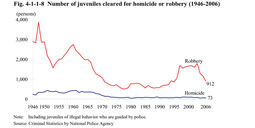
Fig. 4-1-1-8 shows the number of juveniles cleared for homicide or robbery (including juveniles of illegal behavior who are guided by police) since 1946. Fig. 4-1-1-8 Number of juveniles cleared for homicide or robbery (1946-2006)
Those cleared for robbery showed an upward trend since 1989, reaching a peak at 1,800 in 2003. However, the number decreased for three consecutive years from 2004. Most robbery cases were on-the-street robbery (Source: The Community Safety Bureau, National Police Agency). |