| Previous Next Index Image Index Year Selection | |
|
|
2 Trends by attribute
(1) Trends by age group
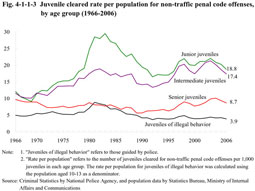
Fig. 4-1-1-3 shows the juveniles cleared rate per 1,000 population for non-traffic penal code offenses (including juveniles of illegal behavior who are guided by police; the rate per population for juveniles of illegal behavior was calculated using the population aged 10-13 as a denominator; hereinafter the same in this Chapter) by age group since 1966 (see Appendix 4-2). Fig. 4-1-1-3 Juvenile cleared rate per population for non-traffic penal code offenses, by age group (1966-2006)
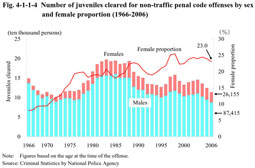
(2) Trends by sex Fig. 4-1-1-4 shows the number of juveniles cleared for non-traffic penal code offenses by sex and the female proportion since 1966. The female proportion, viewed under a long term, has been on a rising trend, but decreased continuously in 2005 and 2006. Fig. 4-1-1-4 Number of juveniles cleared for non-traffic penal code offenses by sex and female proportion (1966-2006)
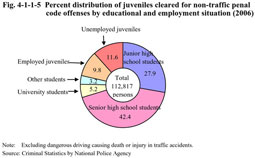
Fig. 4-1-1-5 shows the percent distribution of juveniles cleared for non-traffic penal code offenses (excluding dangerous driving causing death or injury in traffic accidents; hereinafter the same in this subsection) by educational and employment situation. The proportion of senior high school students was the highest, followed by junior high school students, and unemployed juveniles. In recent years, there has not been any big fluctuation in this percent distribution. Fig. 4-1-1-5 Percent distribution of juveniles cleared for non-traffic penal code offenses by educational and employment situation (2006)
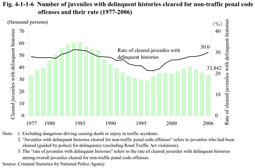
Fig. 4-1-1-6 shows the number of juveniles with delinquent histories cleared for non-traffic penal code offenses (those cleared for non-traffic penal code offenses who had been cleared (guided by police) for delinquency (excluding Road Traffic Act violations); hereinafter the same in this subsection) and their rate (the rate of cleared juveniles with delinquent histories among overall juveniles cleared for non-traffic penal code offenses; hereinafter the same in this subsection) over the last 30 years. The rate of cleared juveniles with delinquent histories has constantly been on an upward trend since 1998. Fig. 4-1-1-6 Number of juveniles with delinquent histories cleared for non-traffic penal code offenses and their rate (1977-2006)
|