| Previous Next Index Image Index Year Selection | |
|
|
3 Clearance rate
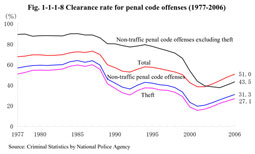
Fig. 1-1-1-8 shows the clearance rates for penal code offenses over the last 30 years.
Fig. 1-1-1-8 Clearance rate for penal code offenses (1977-2006)
|
| Previous Next Index Image Index Year Selection | |
|
|
3 Clearance rate
Fig. 1-1-1-8 shows the clearance rates for penal code offenses over the last 30 years.
Fig. 1-1-1-8 Clearance rate for penal code offenses (1977-2006)
|