| Previous Next Index Image Index Year Selection | |
|
|
1 Prosecution (1) Final disposition
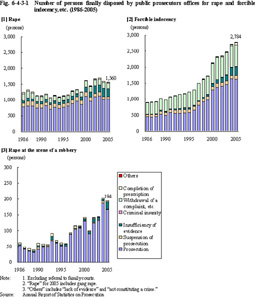
Fig. 6-4-3-1 shows trends in the numbers of persons finally disposed by public prosecutors offices for rape, forcible indecency, and rape at the scene of a robbery, over the last 20 years.
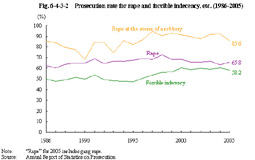
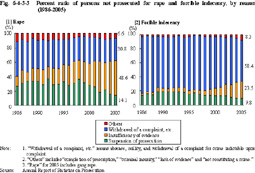
Fig. 6-4-3-1 Number of persons finally disposed by public prosecutors offices for rape and forcible indecency, etc. (1986-2005) Fig. 6-4-3-2 shows trends in the prosecution rate for rape, forcible indecency, and rape at the scene of a robbery, over the last 20 years.Fig. 6-4-3-2 Prosecution rate for rape and forcible indecency, etc. (1986-2005) Fig. 6-4-3-3 shows trends in the percent ratio of persons not prosecuted for rape and forcible indecency by reason, over the last 20 years.Fig. 6-4-3-3 Percent ratio of persons not prosecuted for rape and forcible indecency, by reason (1986-2005) (2) Persons with previous convictions among those prosecuted
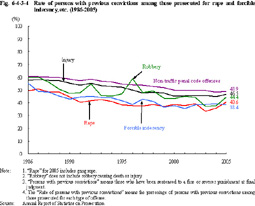
Fig. 6-4-3-4 shows trends in the percentage of persons with previous convictions (meaning those who have been sentenced to a fine or severer punishment at final judgment; hereinafter the same in this Subsection) among overall persons prosecuted for rape and forcible indecency, etc. (hereinafter referred to as the "rate of persons with previous convictions" in this Subsection), over the last 20 years.
Fig. 6-4-3-4 Rate of persons with previous convictions among those prosecuted for rape and forcible indecency, etc. (1986-2005) |


