|
2 Trends by type of offenders
We will analyze trends of various offenders by their attributes.
(1) Female offenses
Fig. 6-2-2-4 shows trends in the number of persons cleared for non-traffic penal code offenses, by sex.
Fig. 6-2-2-4 Number of persons cleared for non-traffic penal code offenses by sex (1973-2005)
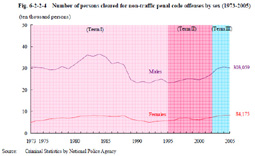
Females showed an upward trend in all terms. In recent years, females have accounted for nearly 20% of the total number of persons cleared for non-traffic penal code offenses. The increase in the number of cleared females seems to have had contributed to the overall increase. Although there have recently been peculiar heinous crimes committed by females, theft is the most common for female offenders, accounting for nearly 70% of the total number of females cleared for non-traffic penal code offenses, among which shoplifting has been largest in number (see Part 1, Chapter 1, Section 1, 2). No significant changes were observed in the fact that most offenses have been still committed by males.
(2) Juvenile delinquency
Fig. 6-2-2-5 shows trends in the number of adults and juveniles cleared for non-traffic penal code offenses.
Fig. 6-2-2-5 Number of adults and juveniles cleared for non-traffic penal code offenses (1973-2005)
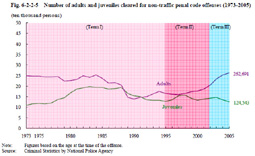
The number of persons cleared for non-traffic penal code offenses hit a peak in 1984 during Term I mainly due to an increase in the number of cleared juveniles. In this term, the number was large for juveniles cleared for theft, in particular for shoplifting, and by age group, the number of junior juveniles was the largest (see Part 4, Chapter 1, Section 1, 2). Looking at the trends in the number of persons cleared for non-traffic penal code offenses, juveniles outnumbered adults from 1989 to 1991, but adults have been larger in number ever since. In Term II, juveniles have remained almost flat after hitting a peak in 1998. In the meantime, adults started to show an increase in the middle of Term II and increased sharply in Term III. The significant increase in the total number of persons cleared for non-traffic penal code offenses during Term III was brought about not by an increase of cleared juveniles but of cleared adults.
However, as the White Paper on Crime 2005 pointed out, recent juvenile delinquency, along with recent serious criminal trend, has become one of the causes of the general public's heightened anxiety. It is an extremely important issue for Japan to consider how to prevent juvenile delinquency from occurring and how society as a whole, including families, should foster juveniles who will support the next generation.
(3) Offenses by foreign nationals
Fig. 6-2-2-6 shows trends in the number of persons cleared for non-traffic penal code offenses (excluding dangerous driving causing death or injury in connection with traffic accidents; hereinafter the same in this Section) by nationality.
Fig. 6-2-2-6 Number of persons cleared for non-traffic penal code offenses by nationality (1973-2005)
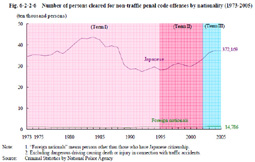
The number of foreign nationals cleared for non-traffic penal code offenses has been on a rise since 1999 and was the largest ever in 2005 (see Part 3, Chapter 1, Section 2,1). The ratio of foreign nationals among the total number of those cleared for non-traffic penal code offenses was 3.8% in 2005, and their increases and decreases have had only small impact on the total number.
However, the increase in drug offenses and violent and organized theft and robbery cases committed by visiting foreign nationals has rapidly raised people's anxiety and wariness against offenses. In recent years, there have been heinous offenses committed by foreign nationals linked to Boryokudan groups. Also, from the viewpoint of criminal policy, the increase in the number of foreign offenders, who require different measures and treatment from Japanese offenders, has raised various problems that should be called "problems of visiting foreign nationals." Their increases and decreases have had no small impact on criminal justice agencies.
(4) Repeat offenders
Fig. 6-2-2-7 shows trends in the number of repeat offenders (those who have once been cleared for penal code offenses or special act offenses (excluding Road Traffic Act violations; hereinafter the same in this Section)) cleared for non-traffic penal code offenses.
Fig. 6-2-2-7 Number of first-time offenders and repeat offenders cleared for non-traffic penal code offenses (1973-2005)
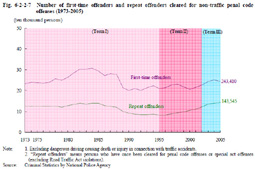
In 1984, when the number of persons cleared for non-traffic penal code offenses hit the peak of Term I, the number of repeat offenders also marked the largest record and showed almost the same trend with the total number of cleared persons. However, in recent years, the number of repeat offenders has been increasing and their proportion to all persons cleared for non-traffic penal code offenses has also been on an upward trend (see Part 3, Chapter 5, Section 1, 1).
Fig. 6-2-2-8 shows trends in the number of persons cleared for non-traffic penal code offenses by state of employment.
Fig. 6-2-2-8 Number of persons cleared for non-traffic penal code offenses by state of employment (1973-2005)
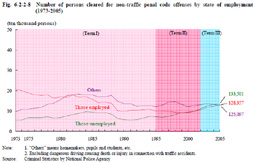
Since 2002, those unemployed have outnumbered those employed. Those unemployed have shown a higher rate for termination of probationary supervision due to revocation (see Part 2, Chapter 5, Section 2, 4) and their rate among the total number of cleared persons has also been increasing. Therefore, it has come to be required to enhance and strengthen treatment of such offenders, including providing them with employment support so as to prevent them from repeating offenses.
|