| Previous Next Index Image Index Year Selection | |
|
|
1 Trends in the number of persons cleared for non-traffic penal code offenses
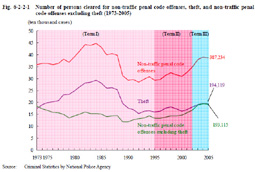
Fig. 6-2-2-1 shows trends in the number of persons cleared for non-traffic penal code offenses, theft, and non-traffic penal code offenses excluding theft.
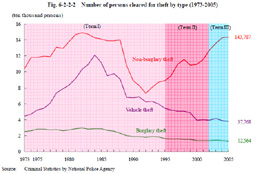
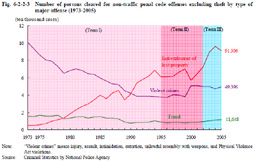
Fig. 6-2-2-1 Number of persons cleared for non-traffic penal code offenses, theft, and non-traffic penal code offenses excluding theft (1973-2005) In Term I, the number of persons cleared for non-traffic penal code offenses started to increase significantly in 1980 but showed a declining trend after marking a post-WWII record in 1984. Theft showed almost the same trend as non-traffic penal code offenses, accounting for 65.6% (292,835 persons) of the total of those cleared for non-traffic penal code offenses (446,617 persons) in 1984. Meanwhile, non-traffic penal code offenses excluding theft were decreasing gradually until 1989, but started to show an upward trend after that.In Term II, the number of persons cleared for non-traffic penal code offenses started to increase significantly in 2001. The increase in non-traffic penal code offenses excluding theft between 1995 and 2002 (up by 33,356 persons) was larger than that in theft (up by 21,272 persons). Also in Term III, the number of persons cleared for non-traffic penal code offenses showed an upward trend, but decreased slightly from the previous year in 2005. It is notable that since 2003, the number of those cleared for theft has been almost the same as that for non-traffic penal code offenses excluding theft. Fig. 6-2-2-2 shows trends in the number of persons cleared for theft by type. Fig. 6-2-2-2 Number of persons cleared for theft by type (1973-2005) Non-burglary theft was largest in number in all terms, and its increases and decreases have had a significant impact on the total number of persons cleared for theft. By modus operandi of non-burglary theft, the number of persons cleared for shoplifting, which was 68,932 persons in 1995, increased significantly to 100,849 persons in 2002 and 113,953 persons in 2005. Most of the increase in non-burglary theft is attributable to the increase in shoplifting.Fig. 6-2-2-3 shows trends in the number of persons cleared for non-traffic penal code offenses excluding theft, by type of major offense. In Term I, embezzlement of lost property increased significantly, while violent crimes decreased sharply and fraud was also on a moderate declining trend. In Term II, after showing slight increases and decreases, embezzlement of lost property started to increase sharply again in 2001. Violent crimes remained flat in the first half of this term but showed a significant increase in 2000. In Term III, embezzlement of lost property continued to increase, marking a post-WWII record in 2004. Violent crimes remained almost flat, but by type of offense, assault continued to increase. Fraud, which started to show an increase in 2000, also continued to increase even in Term III. All these indicate that the upward trend since 1990 in non-traffic penal code offenses excluding theft was mainly due to an increase in embezzlement of lost property. Fig. 6-2-2-3 Number of persons cleared for non-traffic penal code offenses excluding theft by type of major offense (1973-2005) |


