| Previous Next Index Image Index Year Selection | |
|
|
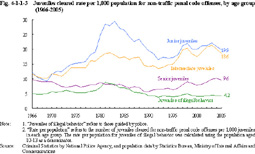
2 Trends by attribute (1) Trends by age group a. Rate per population by age group Fig. 4-1-1-3 shows the juveniles cleared rate per 1,000 population for non-traffic penal code offenses (including juveniles of illegal behavior who are guided by police; the rate per population for juveniles of illegal behavior was calculated using the population aged 10-13 as a denominator; hereinafter the same in this Chapter) by age group since 1966 (See Appendix 4-2).
Fig. 4-1-1-3 Juveniles cleared rate per 1,000 population for non-traffic penal code offenses, by age group (1966-2005)
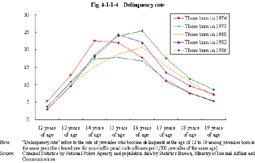
b. Delinquency rate Fig. 4-1-1-4 shows how the delinquency rate (the rate of juveniles who become delinquents at the age of 12 to 19 among juveniles born in the same year (the cleared rate for non-traffic penal code offenses per 1,000 juveniles of the same age); hereinafter the same in this subsection) of the juveniles born in the same year changes as they grow.
In all age groups, the delinquency rate is high at the age of 14 to 16, as the delinquency rate tends to be low as juveniles become old.^ Fig. 4-1-1-4 Delinquency rate
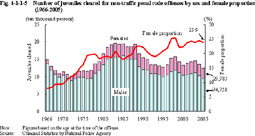
(2) Trends by sex Fig. 4-1-1-5 shows the number of juveniles cleared for non-traffic penal code offenses by sex and the female proportion since 1966.
Fig. 4-1-1-5 Number of juveniles cleared for non-traffic penal code offenses by sex and female proportion (1966-2005)
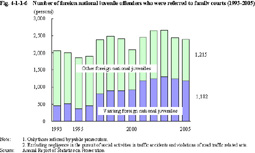
(3) Trends in foreign national juvenile offenders Fig. 4-1-1-6 shows the trend of the number of foreign national juveniles referred to family courts by public prosecutors offices (excluding negligence in the pursuit of social activities in traffic accidents and violations of road traffic related acts; hereinafter the same in this subsection) since 1993.
Fig. 4-1-1-6 Number of foreign national juvenile offenders who were referred to family courts (1993-2005)
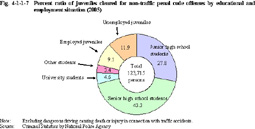
(4) Educational and employment situation and delinquency Fig. 4-1-1-7 shows the percent ratio of juveniles cleared for non-traffic penal code offenses (excluding dangerous driving causing death or injury in connection with traffic accidents; hereinafter the same in this subsection) by educational and employment situation.
Fig. 4-1-1-7 Percent ratio of juveniles cleared for non-traffic penal code offenses by educational and employment situation (2005)
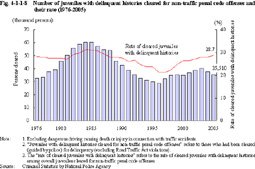
(5) Delinquency by juveniles with delinquent histories Fig. 4-1-1-8 shows the number of juveniles with delinquent histories cleared for non-traffic penal code offenses (those cleared for non-traffic penal code offenses who had been cleared (guided by police) for delinquency (excluding Road Traffic Act violations); hereinafter the same in this subsection) and their rate (the rate of cleared juveniles with delinquent histories among overall juveniles cleared for non-traffic penal code offenses; hereinafter the same in this subsection) over the last 30 years.
The rate of cleared juveniles with delinquent histories has constantly been on an upward trend since 1998. Fig. 4-1-1-8 Number of juveniles with delinquent histories cleared for non-traffic penal code offenses and their rate (1976-2005)
|