| Previous Next Index Image Index Year Selection | |
|
|
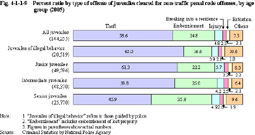
3 Trend in type of offense (1) Percent ratio by type of offense Fig. 4-1-1-9 shows the percent ratio by type of offense of juveniles cleared for non-traffic penal code offenses (including juveniles of illegal behavior who are guided by police) in 2005, by age group (See Appendix 4-3).
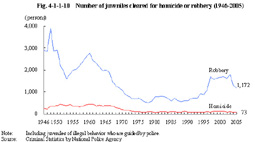
Fig. 4-1-1-9 Percent ratio by type of offense of juveniles cleared for non-traffic penal code offenses, by age group (2005) (2) Homicide and robbery Fig. 4-1-1-10 shows the number of juveniles cleared for homicide or robbery (including juveniles of illegal behavior who are guided by police) since 1946.
Fig. 4-1-1-10 Number of juveniles cleared for homicide or robbery (1946-2005) Those cleared for homicide showed increases and decreases between 200 and 500 until 1965, but have been on a declining trend since then, remaining below more or less 100 since 1975. From 1998 to 2001, the number exceeded 100, but has been below 100 again since 2002Those cleared for robbery showed an upward trend since 1989, reaching a peak at 1,800 in 2003. However, the number decreased continuously in 2004 and 2005. Most robbery cases were on-the-street robbery (Source: The Community Safety Bureau, National Police Agency). |

