| Previous Next Index Image Index Year Selection | |
|
|
4 Complicity cases (1) Complicity rate Among 633,119 cases cleared for non-traffic penal code offenses (excluding dangerous driving causing death or injury in connection with traffic accidents; hereinafter the same in this subsection) (excluding cases where it was confirmed as a result of investigation that the act in question did not constitute a crime or that the conditions for prosecution or punishment were not satisfied; hereinafter the same in this subsection) in 2005, 506,910 cases (80.1% of the total) were committed by a sole perpetrator and 126,209 cases (19.9%) were in complicity. The complicity rate (the rate of cases committed in complicity among total cases; hereinafter the same in this subsection) was 25.8% for cases by juveniles only, higher than that for cases by adults only (17.0%), showing juveniles' stronger tendency to commit crimes in complicity (Source: Criminal Statistics by National Police Agency).
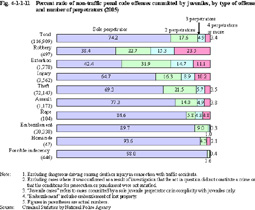
Fig. 4-1-1-11 shows the percent ratio of non-traffic penal code offenses committed by only juveniles in 2005, by number of perpetrators and type of offense. Among cases committed by only juveniles, the complicity rate was highest for robbery (61.6%), followed by extortion (57.6%) and injury (35.3%), showing much higher rates than those for cases committed by only adults (robbery - 27.5%, extortion - 36.3%, and injury - 10.1%). The rate of cases committed in complicity with four or more persons was highest for robbery (23.5%). Fig. 4-1-1-11 Percent ratio of non-traffic penal code offenses committed by juveniles, by type of offense and number of perpetrators (2005)
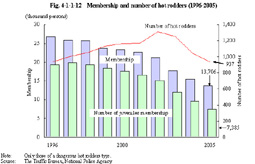
(2) Hot rodders Fig. 4-1-1-12 shows the trend in membership and number of hot rodders since 1996.
The number of juvenile hot rodders has been decreasing since 1998, and the number of hot rodder groups has also been decreasing since 2003. Fig. 4-1-1-12 Membership and number of hot rodders (1996-2005)
|