| Previous Next Index Image Index Year Selection | |
|
|
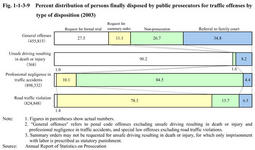
3. Treatment of traffic offenders (1) Disposition by public prosecutors Fig. 1-1-3-9 compares the percent distribution of persons finally disposed by public prosecutors in2003,for traffic offenses(unsafe driving resulting in death or injury,professional negligence in traffic accidents,and road traffic violation)and non-traffic offenses(penal code offenses excluding traffic offenses,and special law offenses).The rates of prosecutions and requests for formal trials for professional negligence in traffic accidents were lower than those for non-traffic offenses.On the other hand,among persons referred for unsafe driving resulting in death or injury,only1.6%were not prosecuted,whereas public trials were requested for about90%and the rest were referred to family courts.The rate of request for summary orders is extremely high and the rate of non-prosecution is low for road traffic violation.
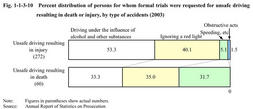
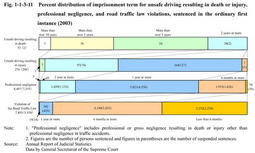
Fig. 1-1-3-9 Percent distribution of persons finally disposed by public prosecutors for traffic offenses by type of disposition(2003) Fig. 1-1-3-10 shows the percent distribution of persons for whom formal trials were requested for unsafe driving resulting in death or injury in2003,by type of accidents.Of persons unsafe driving resulting in injury,the most common was for driving under the influence of alcohol and other substances with53.3%,followed by ignoring a red light with40.1%,which collectively accounted for more than90%of the total.Of persons unsafe driving resulting in death,the most common was for ignoring a red light with35.0%,followed by driving under the influence of alcohol and other substances with33.3%,and speeding,etc.with31.7%.Fig. 1-1-3-10 Percent distribution of persons for whom formal trials were requested for unsafe driving resulting in death or injury,by type of accidents(2003) (2) Disposition by courts Fig. 1-1-3-11 shows the percent distribution of the term of imprisonment for unsafe driving resulting in death or injury,professional negligence(including other than cases in traffic accidents),and road traffic law violations,in the ordinary first instance in2003.The percentage of unsuspended imprisonment with or without labor was36.8%for unsafe driving resulting in death or injury,13.5%for professional negligence,and24.8%for road traffic law violations.Among121persons who were not granted suspended sentence for unsafe driving resulting in death or injury,persons imprisoned for more than five years were20(16.5%),and three were sentenced more than10years imprisonment.
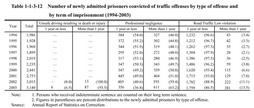
In 2003,for professional negligence,229persons were sentenced to fines in ordinary first instance and91,712 to fines in summary proceedings.For road traffic violation,555persons were sentenced to fines in the ordinary first instance and646,983to fines in summary proceedings(Source:Annual Report of Judicial Statistics). Fig. 1-1-3-11 Percent distribution of imprisonment term for unsafe driving resulting in death or injury,professional negligence,and road traffic law violations,sentenced in the ordinary first instance(2003) (3) Correction and rehabilitation of traffic offenders Table 1-1-3-12 shows the number of newly admitted prisoners convicted of traffic offenses(unsafe driving resulting in death or injury,professional negligence,and violation of the Road Traffic Law;hereinafter the same in this section.)over the last10years.The newly admitted prisoners for traffic offenses began to rise in1998,and increased by4.1%from the previous year to3,140in2003.
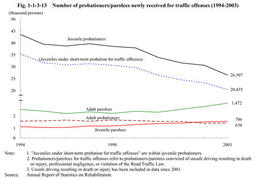
An adult male prisoner convicted of traffic offenses is provided open treatment,if he is deemed suitable for open treatment and meets the following requirements:(i)he is not simultaneously serving a sentence of imprisonment with labor for any non-traffic offense;(ii)he has never been imprisoned for any non-traffic offense;(iii)term of sentence is about three months or more;and(iv)no physical or mental disorder is identified.Those traffic offenders are detained in designated facilities nationwide,including the Ichihara Prison,where in principle,living rooms,dining halls,and workshops are not locked,no escorts are present on the prison premises,and treatment programs necessary for social rehabilitation have been provided such as living guidance,academic education,vocational training,and traffic safety education. Table 1-1-3-12 Number of newly admitted prisoners convicted of traffic offenses by type of offense and by term of imprisonment(1994-2003) Juveniles sent to juvenile training schools for traffic offenses also have increased since1999.In2003,the number of juveniles sent to training schools for unsafe driving resulting in death or injury increased by one from the previous year to three,while those for professional negligence decreased by25to73,and those for violations of the Road Traffic Law decreased by40to665(Source:Annual Report of Statistics on Correction)..Traffic offenders make up a large part of probationers/parolees.In2003,probationers/parolees for traffic offenses accounted for41.3%of all new probationers/parolees,60.0%of juvenile probationers/parolees in particular. Fig. 1-1-3-13 shows the number of newly received probationers/parolees for traffic offenses over the last10years,by probation/parole type.Juvenile probationers have been on the decline,and adult probationers have also gradually decreased.On the other hand,adult parolees and juvenile parolees have been slightly on the rise. Supervision programs for traffic probationers/parolees are conducted with the aim of developing their law-abiding spirit,teaching traffic regulations and improving their surrounding environment.In particular,for juvenile traffic probationers(excluding those under short-term probation for traffic offenses;see Part4,Chapter2,Section6 ),curriculum method using textbooks is conducted along with individual guidance by probation officers and voluntary probation officers.For adult probationers/parolees,guidance is focused on seeking the understanding and cooperation of their families or people at their workplace,and on advice on paying compensation for damage or consolation money to their victims. Fig. 1-1-3-13 Number of probationers/parolees newly received for traffic offenses(1994-2003) |
