| Previous Next Index Image Index Year Selection | |
|
|
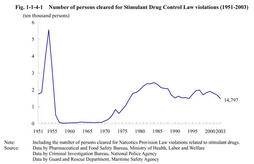
1. Trend in drug offenses (1) Stimulant Drug Control Law violations Fig. 1-1-4-1 shows the number of persons cleared for Stimulant Drug Control Law(Law No.252of1951)violations(including Narcotics Provision Law violations related to stimulant drugs;hereinafter the same in this sub-section)since1951.Stimulant drug abuse began to become widespread during the chaotic postwar period,and experienced two boom periods until now.Persons cleared fell sharply after a peak at55,664in1954.Reasons behind this trend were pointed out that penal regulations were tightened in1954and1955,that clearance by police was implemented thoroughly,and that educational campaigns concerning the harmful influence of stimulant drugs were held nationally.The number of persons cleared took an upward turn again in1970and reached24,372in1984,entering the second boom period.From then,it fell below20,000in1989and decreased to14,896in1994.It started to increase again in1995and came to almost20,000in1997and2000,when it entered the third bo om period.However,it has not continued to rise,and decreased by2,167(12.8%)from the previous year to14,797in2003.
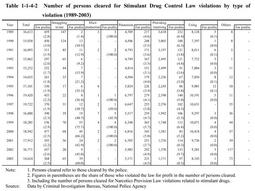
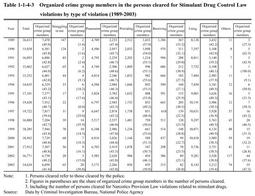
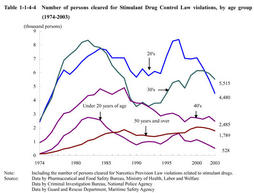
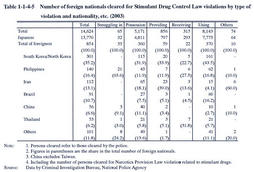
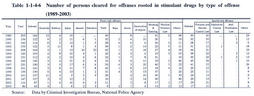
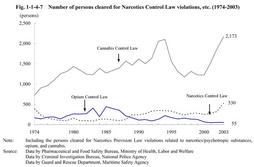
Fig. 1-1-4-1 Number of persons cleared for Stimulant Drug Control Law violations(1951-2003) The percentage of those who violated the law for profit to total persons cleared has been stable between one and two percents every year other than1990when it came to3.0%.In2003,it reached2.5%.In the same year,of those who violated the law for profit,the largest was for possessing with231,followed by providing or receiving drugs with97. Table 1-1-4-2 Number of persons cleared for Stimulant Drug Control Law violations by type of violation(1989-2003) Table 1-1-4-3 Organized crime group members in the persons cleared for Stimulant Drug Control Law violations by type of violation(1989-2003) Table 1-1-4-4 Number of persons cleared for Stimulant Drug Control Law violations,by age group(1974-2003) Table 1-1-4-5 Number of foreign nationals cleared for Stimulant Drug Control Law violations by type of violation and nationality,etc.(2003) Table 1-1-4-6 Number of persons cleared for offenses rooted in stimulant drugs by type of offense(1989-2003) (2) Narcotics Control Law violations,etc. Fig. 1-1-4-7 shows the number of persons cleared for Narcotics Control Law violations(including Narcotics Provision Law violations related to narcotics and psychotropic substances;hereinafter the same in this sub-section),Opium Control Law(Law No.71of1954)violations(including Narcotics Provision Law violations related to opium;hereinafter the same in this sub-section),and Cannabis Control Law(Law No.124of1948)violations(including Narcotics Provision Law violations related to cannabis;hereinafter the same in this sub-section).
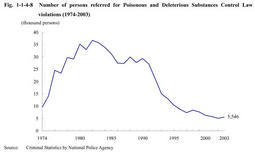
Persons cleared for Cannabis Control Law violations rose overall to2,103in1994.Then they fell sharply but rose again rapidly since2001,and reached2,173in2003more than the peak of1994.Persons cleared for Narcotics Control Law violations have risen since2001to530in2003,a62.1%(327)increase from the previous year. Fig. 1-1-4-7 Number of persons cleared for Narcotics Control Law violations,etc.(1974-2003) (3) Poisonous and Deleterious Substances Control Law violations Fig. 1-1-4-8 shows the number of persons referred for Poisonous and Deleterious Substances Control Law violations since1974.Persons referred were between30,000and40,000since1980and peaked at36,796in1982.They then generally decreased below10,000since1996,to5,546in2003.
Fig. 1-1-4-8 Number of persons referred for Poisonous and Deleterious Substances Control Law violations(1974-2003) |