| Previous Next Index Image Index Year Selection | |
|
|
2. Trend in traffic offenses (1) Unsafe driving resulting in death or injury and professional negligence in traffic accidents The offense of unsafe driving resulting in death or injury was newly established upon the partial amendment to the Penal Code in2001(entry into force in December2001).Recently,there have been many traffic accidents in which drivers killed or injured people by heinous and dangerous driving that defied traffic laws,such as intoxicated driving and excessive speed violation.However,professional negligence resulting in death or injury has not satisfactorily been applicable to such heinous and serious traffic accidents.The offense of unsafe driving resulting in death or injury regards the act of killing or injuring people in traffic accidents by such heinous and dangerous driving as an offense committed not by negligence but with the intention to cause death or injury,and punishes them similar to injury or injury resulting in death by assault.
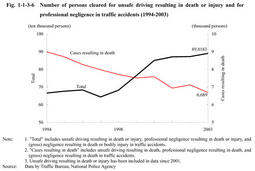
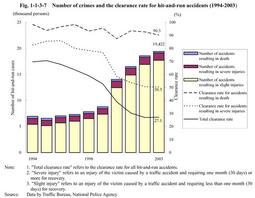
Fig. 1-1-3-6 shows the number of persons cleared for unsafe driving resulting in death or injury and for professional negligence in traffic accidents over the last10years.The total number of persons cleared for professional negligence in traffic accidents has increased since1998,surpassing800,000for the first time in2000.In2003,the number,combined with unsafe driving resulting in death or injury,increased by2.1%from the previous year to890,183.In2003persons cleared for unsafe driving resulting in death increased by17from the previous year to71,and gross negligence resulting in death increased by33to75.On the other hand,persons cleared for professional negligence resulting in death decreased by484from the previous year to6,543in2003. Fig. 1-1-3-6 Number of persons cleared for unsafe driving resulting in death or injury and for professional negligence in traffic accidents(1994-2003) Fig. 1-1-3-7 shows the number of crimes and clearance rate for"hit-and-run accidents(the intentional failure to declare accidents due to professional negligence in traffic,etc.)"over the last10years.The number of crimes increased since1996and has risen noticeably since2000.The clearance rate decreased in recent years,but increased by0.1points from the previous year to27.1%in2003.The clearance rate has generally been within the90-100%range for cases resulting in death since1994,and within the50-60%range for those resulting in severe injuries since2000.Fig. 1-1-3-7 Number of crimes and the clearance rate for hit-and-run accidents(1994-2003) (2) Road Traffic Law violations Along with the establishment of an offense of unsafe driving resulting in death or injury,the Road Traffic Law was also amended by the Law for Partial Amendment to the Road Traffic Law(Law No.51of2001)to make punishment more severe for illegal acts of heinous and dangerous driving,and the amended law entered into force in June2002.
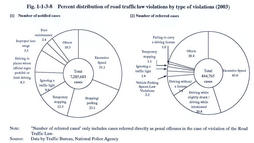
Fig. 1-1-3-8 shows the number of road traffic violations in2003.The road traffic violations generally decreased after the1984peak,but increased by4.0%from the previous year to8,130,448in2003.The number of notified cases of non-penal offenses under the traffic violation notification system was7,285,683(89.6%of the total road traffic law violations).By type of violation,excessive speed was the largest,followed by stopping-parking violation,and temporary stopping.On the other hand,among the cases referred to public prosecutors for road traffic law violations as penal offenses,excessive speed had the highest share,followed by drunk/intoxicated driving,and driving without a license.Those three major violations accounted for73.7%of the total.Referred cases for drunk/intoxicated driving were211,854in2002.The alcohol level to be deemed as drunk became lower and the scope of drunk driving was expanded in accordance with the amended Road Traff ic Law Enforcement Regulations(Cabinet Order No.270of1960)enforced at the time of amendment of the Road Traffic Law.Nonetheless,referred cases for drunk/intoxicated driving decreased by17.1%to175,730in2003,which indicates that more severe punishments under the Law Amendment were effective. Fig. 1-1-3-8 Percent distribution of road traffic law violations by type of violations(2003) |


