| Previous Next Index Image Index Year Selection | |
|
|
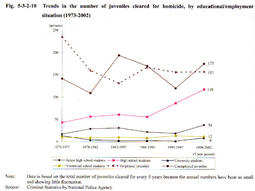
4 Characteristics of juvenile offenders of heinous offenses, by educational/employment situation Examining whether, at the time of the offense, juveniles have been employed/unemployed or in junior high school, high school or university will provide us with useful clues to identify the causes and background factors of their offenses.
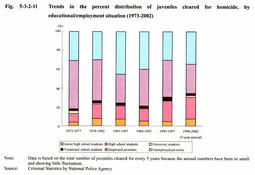
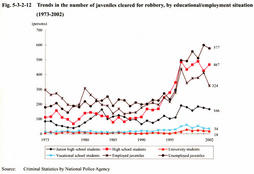
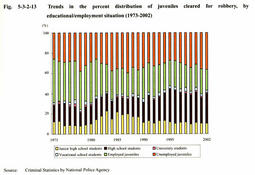
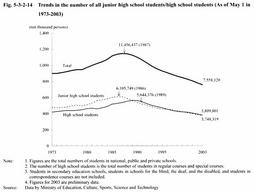
Fig. 5-3-2-10 , Fig. 5-3-2-11 , Fig. 5-3-2-12 , and Fig. 5-3-2-13 show the number of juveniles cleared for homicide and robbery and the percent distribution thereof, by educational/employment situation. Among homicide offenders, data is based on the total number of juveniles cleared for every 5 years because the annual numbers have been so small and showing fluctuation. Both the number and percentage of employed juveniles have been declining slightly after staying at a high level during the 5-year period from 1973, 30 years before, and the number and percentage of unemployed juveniles have also been declining slightly after peaking during the 5-year period form 1983. On the other hand, it is notable that the number and percentage of high school students have been on an upward trend after remaining almost flat during the 20 years from 1973 to 1992. From the 5-year period from 1988 to 1992 to the 5-year period from 1998 to 2002, the number of high school students cleared for homicide increased 2.1-fold. Overall, the gap between employed/unemployed juveniles and high school students has been narrowing. Among robbery offenders, the number of unemployed juveniles has been rising rapidly after remaining flat from 1973 to 1995, and the percentage has been on the rise since 1996 after fluctuating repeatedly until 1995. The number of unemployed juveniles cleared increased 2.5-fold from 1995 to 2002. The number of employed juveniles was larger than the number of unemployed juveniles from 1973 to 1982 and then fell below it. However, the number of employed juveniles started to rise in 1989 and it has been showing an intensified upward trend since 1996 whereas the percentage has been moving sideways. On the other hand, the number of high school students turned up after remaining flat until 1990, and it has been showing a further intensified upward trend since 1994, surpassing the increasing number of employed juveniles and nearly reaching the number of unemployed juveniles. From 1993 to 2002, the number of high school students increased 2.8-fold and the percentage increased accordingly. The number of junior high school students has been small but the percentage has been rising slightly. As shown in Fig. 5-3-2-14 , the numbers of all junior high school students and all high school students have been declining constantly after peaking at about 6,106,000 in 1986 and at about 5,644,000 in 1989. According to preliminary data as of May 2003, the number of all junior high school students was about 3,748,000 (down 38.6% from the peak) and the number of all high school students was about 3,810,000 (down 32.5% from the peak). In light of such significant declines, it is clear that the crime rate per unit population of students has been rising more sharply than shown in the figure above. The gap between employed/unemployed juveniles and high school students has also been narrowing with respect to robbery offenders. However, attention should be paid to the possibility that high school students and employed juveniles may contain a considerable number of juveniles who, even if they do go, do not adapt to school/work, in other words, juveniles who have almost dropped out of school/work, spending their days like unemployed juveniles (for details, see Chapter 4, Section 2 ). Fig. 5-3-2-10 Trends in the number of juveniles cleared for homicide, by educational/employment situation (1973-2002) Fig. 5-3-2-11 Trends in the percent distribution of juveniles cleared for homicide, by educational/employment situation (1973-2002) Fig. 5-3-2-12 Trends in the number of juveniles cleared for robbery, by educational/employment situation (1973-2002) Fig. 5-3-2-13 Trends in the percent distribution of juveniles cleared for robbery, by educational/employment situation (1973-2002) Fig. 5-3-2-14 Trends in the number of all junior high school students/high school students (As of May 1 in 1973-2003) |